Our approach
We start with the changes that move your unit economics. Pricing, offer structure, shipping thresholds, bundles, post-purchase upsells. These are what we call "Tier 1" experiments and they produce much bigger effects (15-40% lifts) and resolve faster than surface-level layout changes. Once we've got these big changes running, we'll layer in what we call "Tier 2" structural improvements that let us test more things but with smaller impacts.
Proof
21 experiments documented in this page across 11 clients, with real results. Three full case studies from engagements (5x to 18x ROI).
Next step
A 30-minute call with Tim Davidson to walk through your current metrics, confirm the opportunity size and answer anything outstanding. tim@cleancommit.io.
The trap that a lot of brands fall into when they start playing around with A/B testing and CRO is focusing on the UI and even the user experience of the store. These things are important but they're much less important than things like price elasticity, the offer you're presenting to customers, discounts, gift with purchase, buy one get one free and other mechanisms which convince customers that the value of what you're offering is greater, and then finding the profitable sweet spot.
Interface changes are low risk and easier to test when you're getting started, but the impacts are lower and they're harder to measure. Plus they usually take a lot longer and a lot of brands don't have the patience when they're first starting out to wait for them to reach significance.
We classify every experiment into tiers based on how directly it affects your unit economics, then prioritize accordingly.
| Tier | What it changes | Expected impact | Examples |
|---|---|---|---|
| Tier 1 | What the customer buys, pays, or receives | 15-40%+ lift | Pricing, shipping thresholds, bundles, offers, subscription models, post-purchase upsells |
| Tier 2 | How the customer gets to the purchase | 8-20% lift | Navigation, checkout flow, cart architecture, search, cross-sell placement, page structure |
| Tier 3 | How existing elements look, read, or feel | 2-8% lift | Copy, colors, layout, imagery, badges, trust signals, social proof styling |
This approach is backed by some pretty significant studies (Wharton, Browne & Jones).
The question we want to ask when deciding which tests to run is: would this change make the customer's bank statement look different? If the answer is yes, it falls into Tier 1.
Below is a full set of examples of high-impact tests we've run for our clients. These are real experiments with real results, showing the kinds of changes we make and the impacts they produce. 10 Tier 1 experiments that change unit economics, and 11 Tier 2 experiments that change how customers buy.
| # | Tier | Experiment | Client | Key Result |
|---|---|---|---|---|
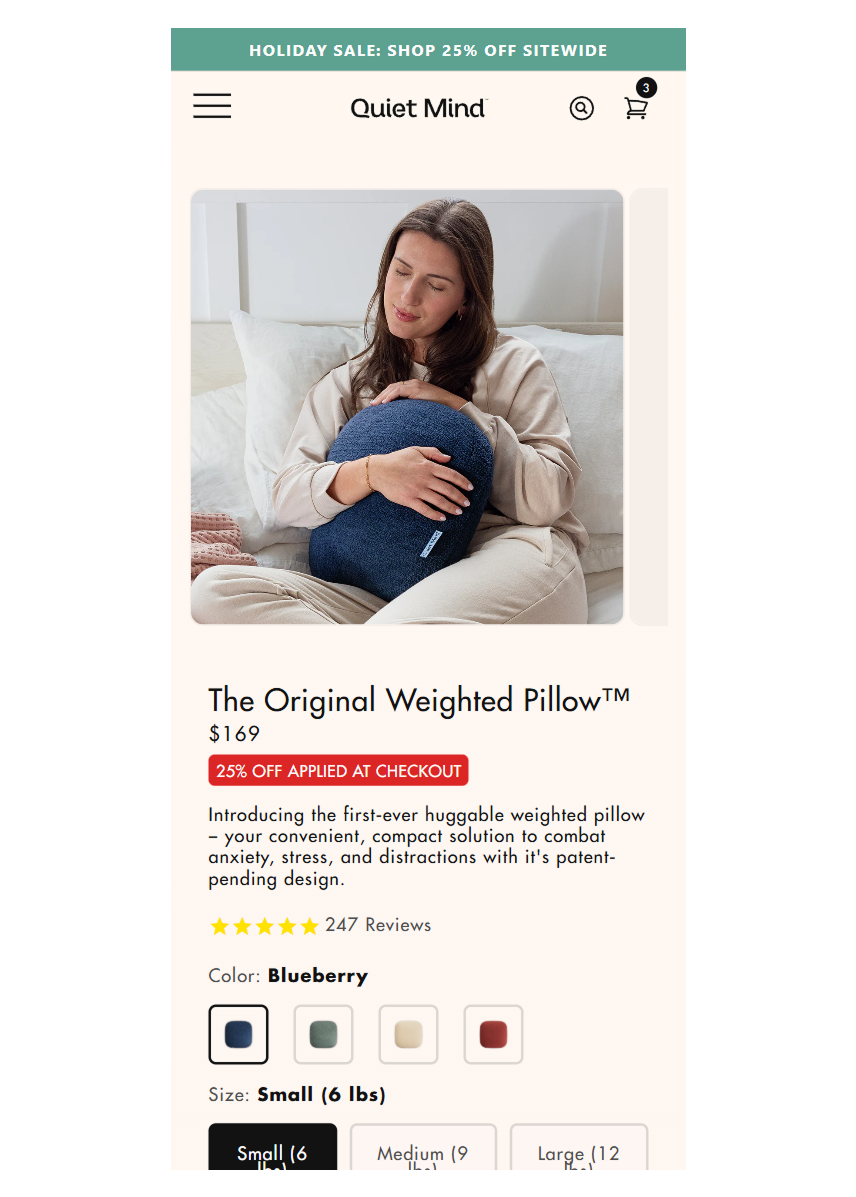
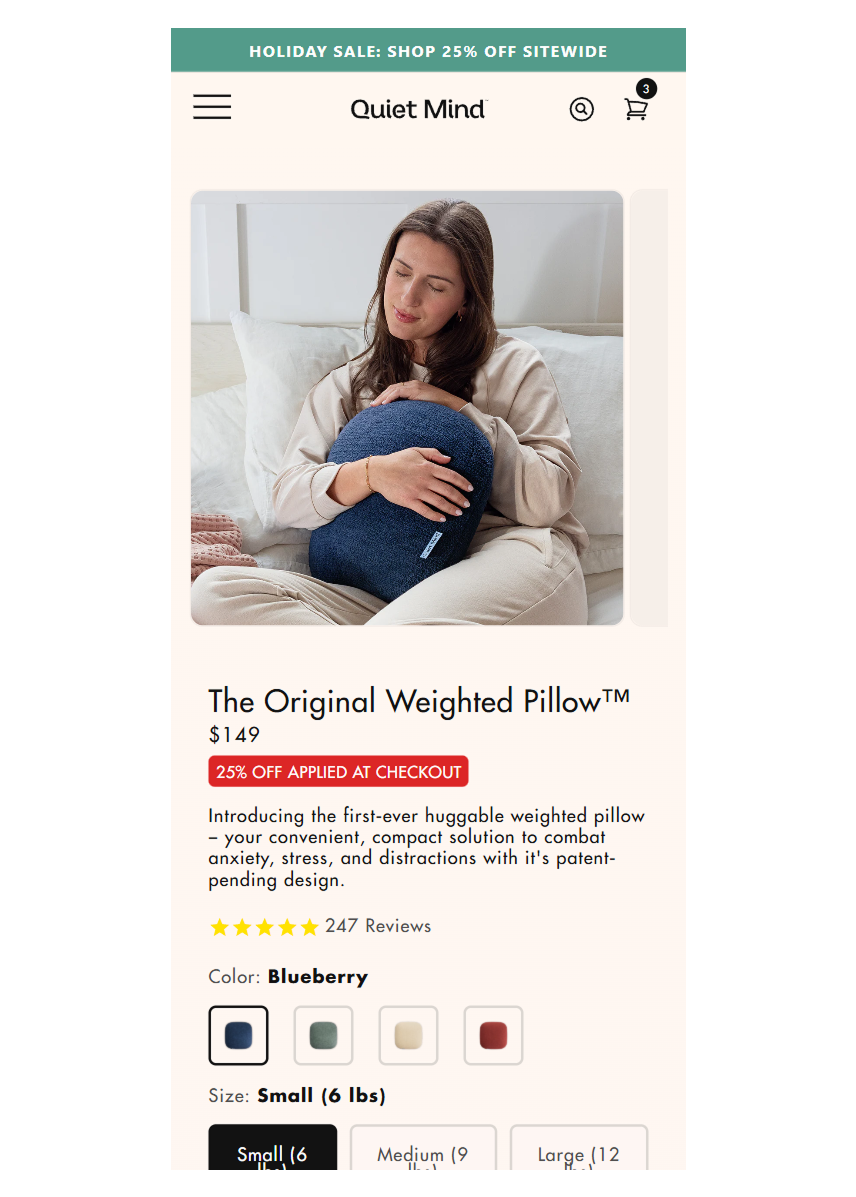
| 1 | T1 | Price increase on hero SKUs | One Quiet Mind | +42.5% CVR, +33.4% RPV |
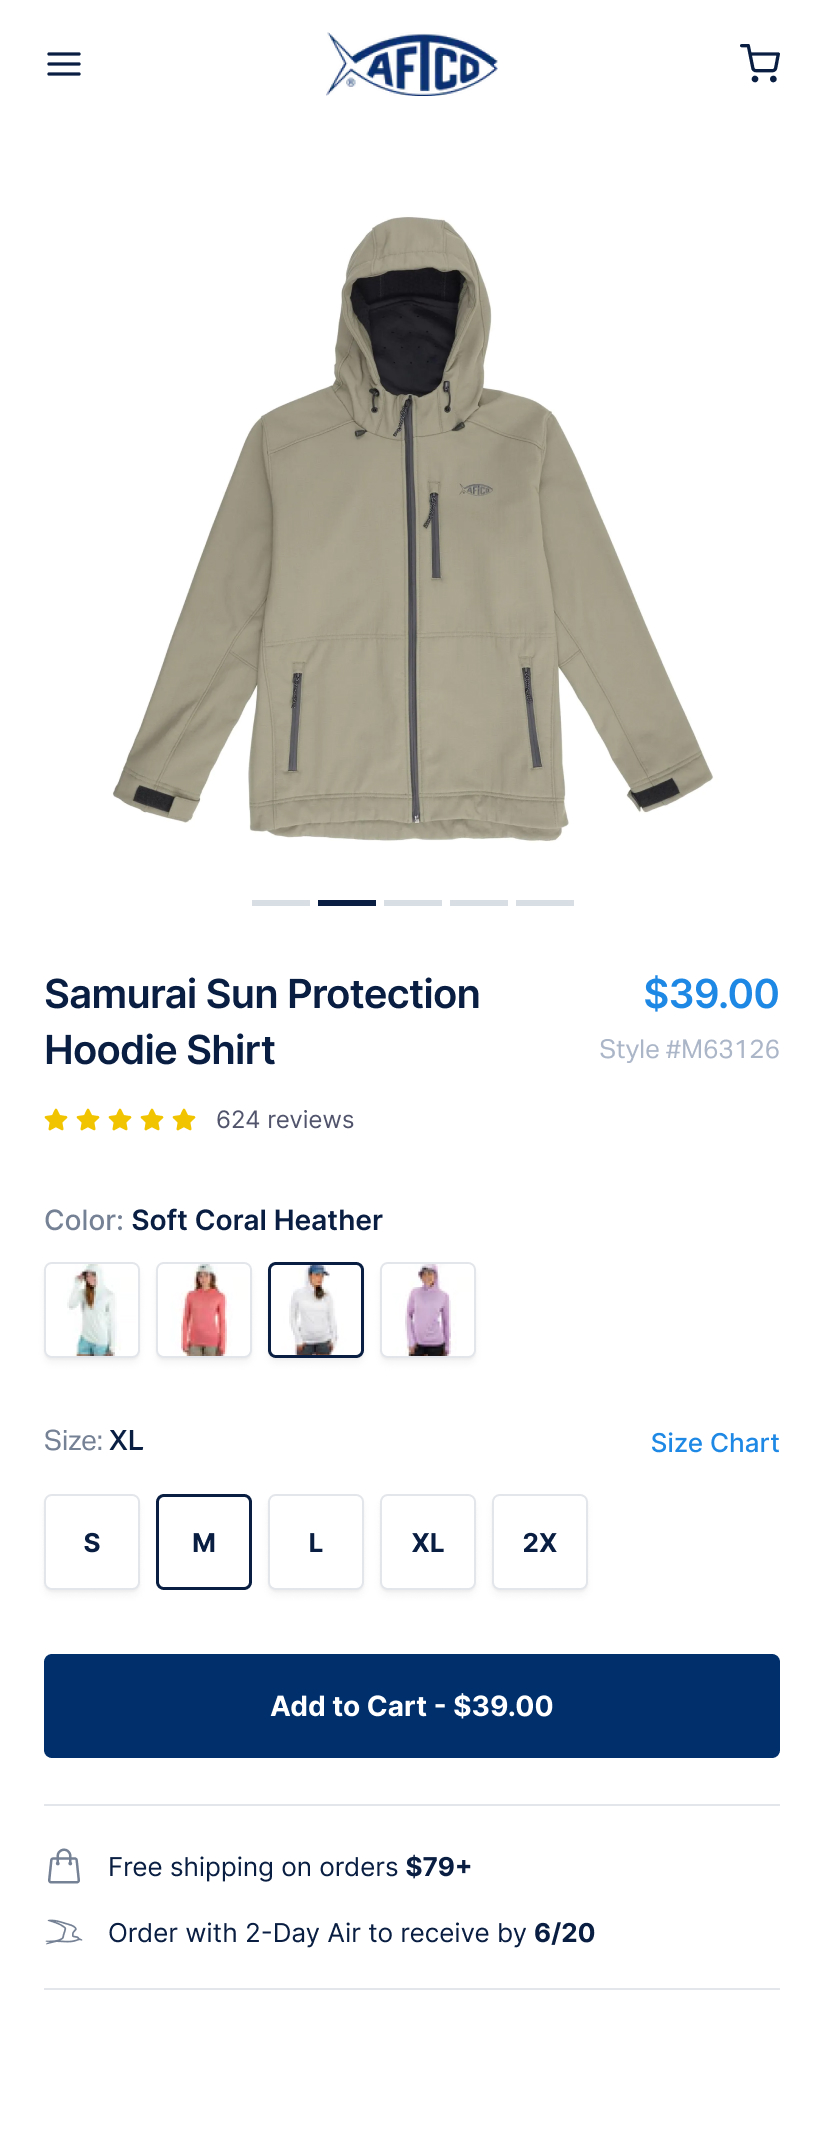
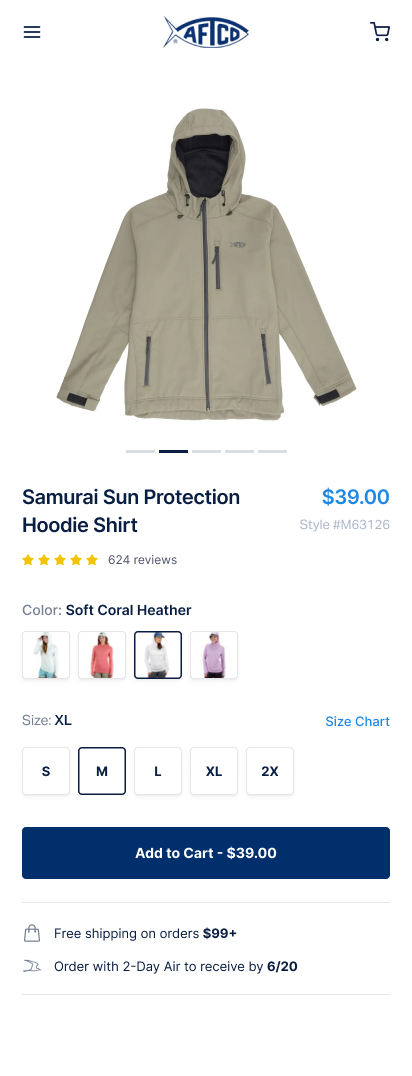
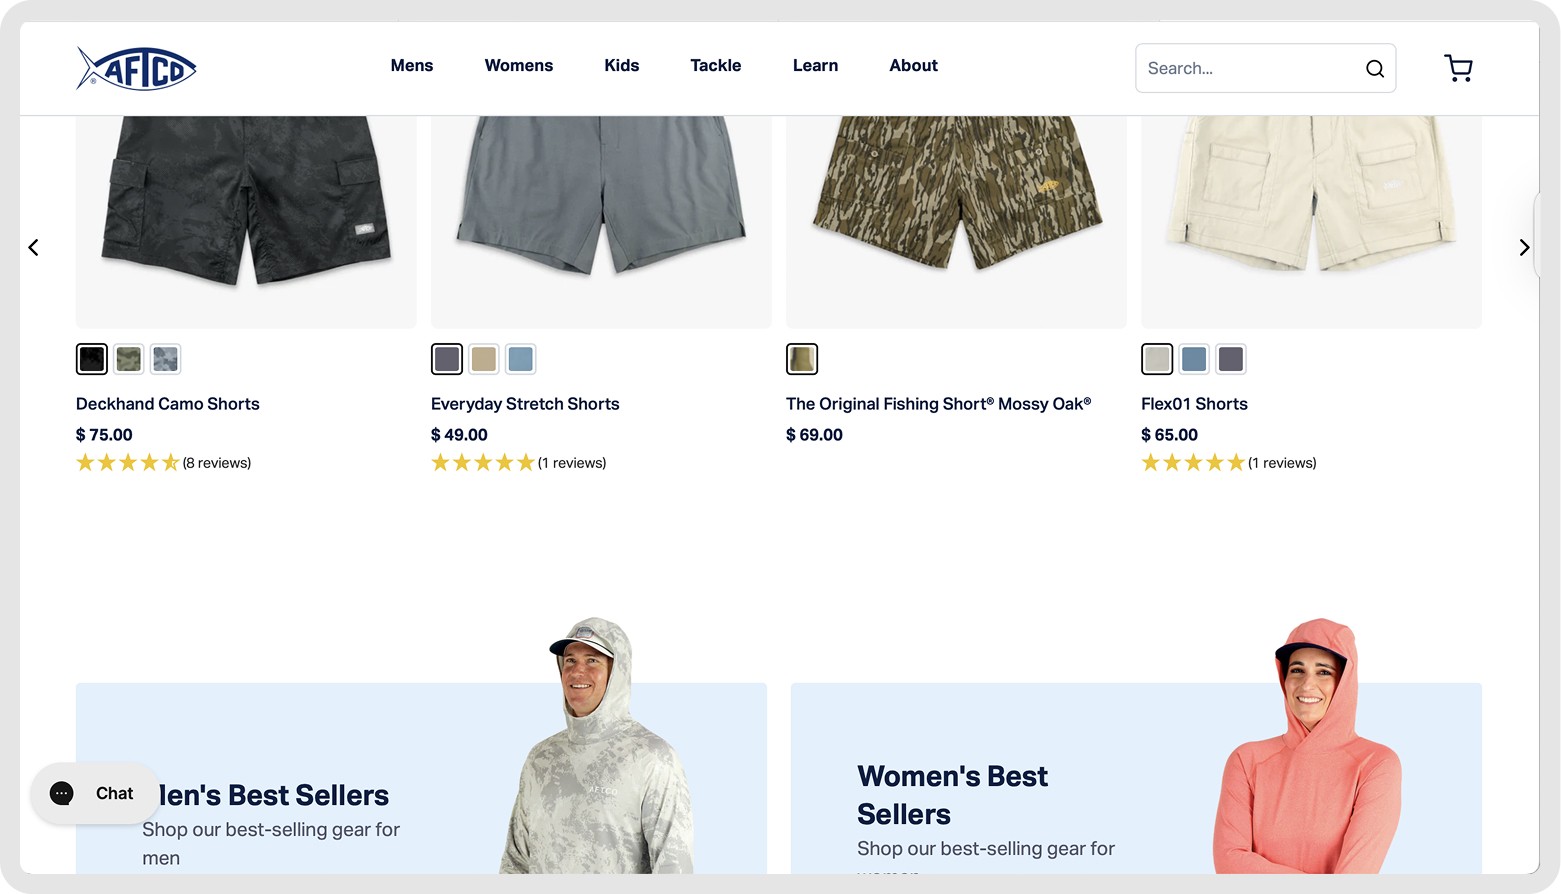
| 2 | T1 | Free shipping threshold optimization | AFTCO | +12% AOV, +4% net revenue |
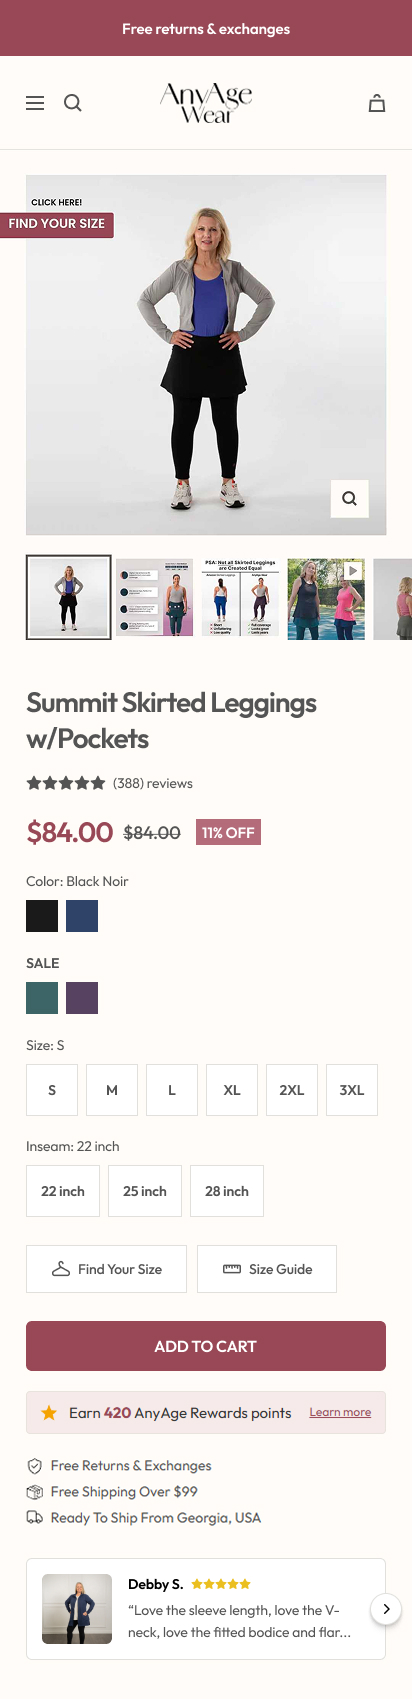
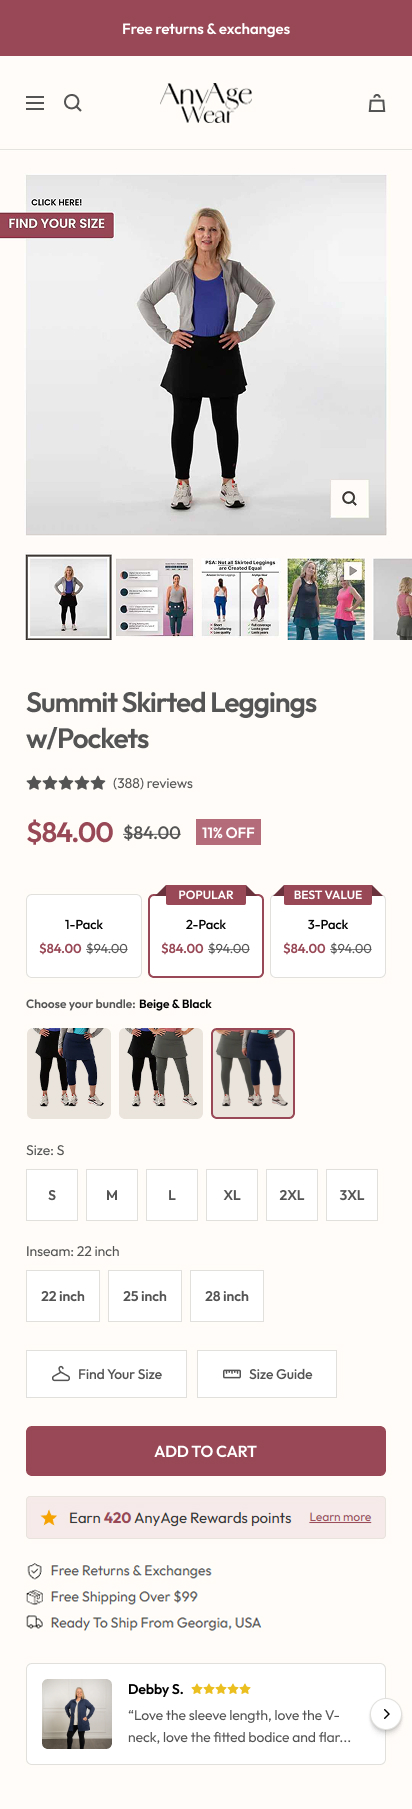
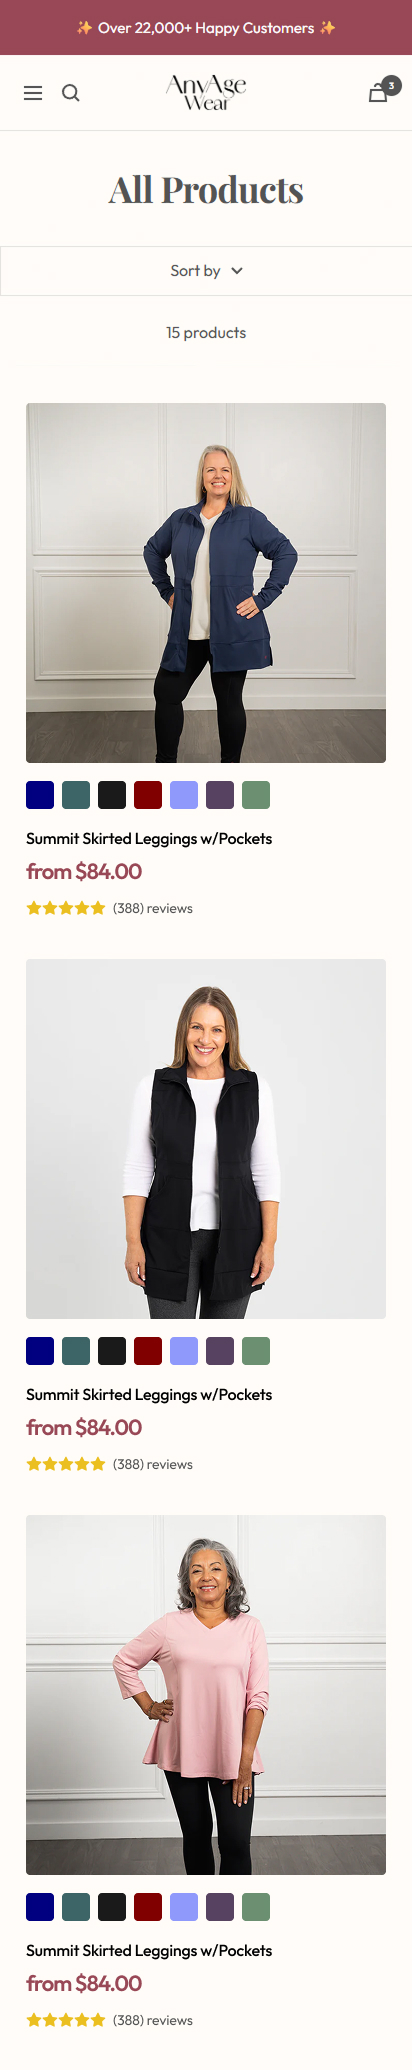
| 3 | T1 | Starter bundle introduction | AnyAge Wear | +16% AOV |
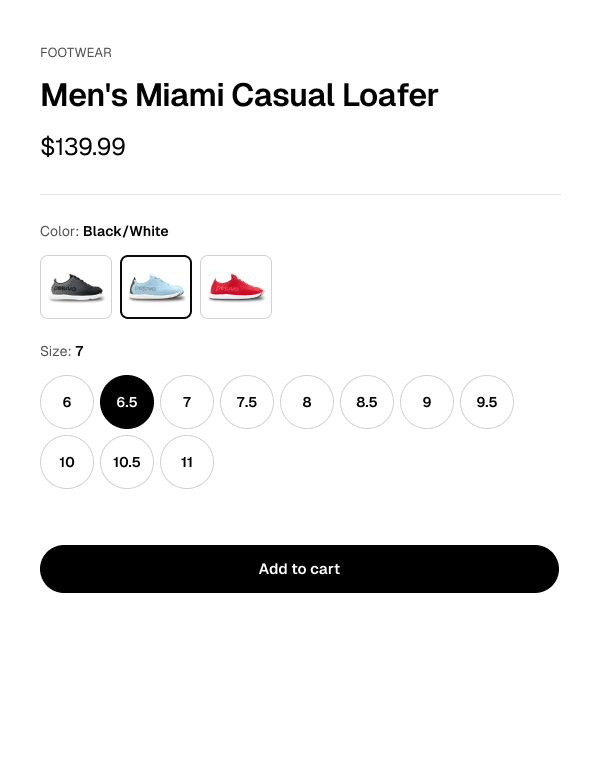
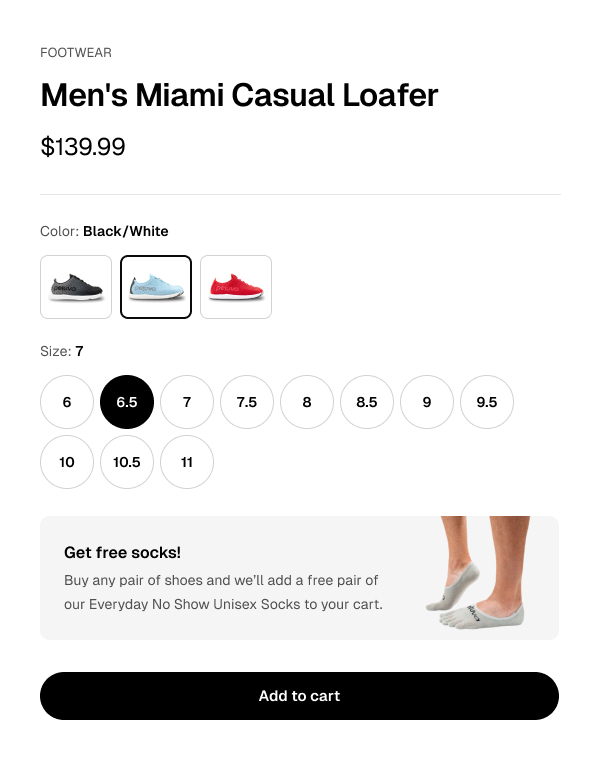
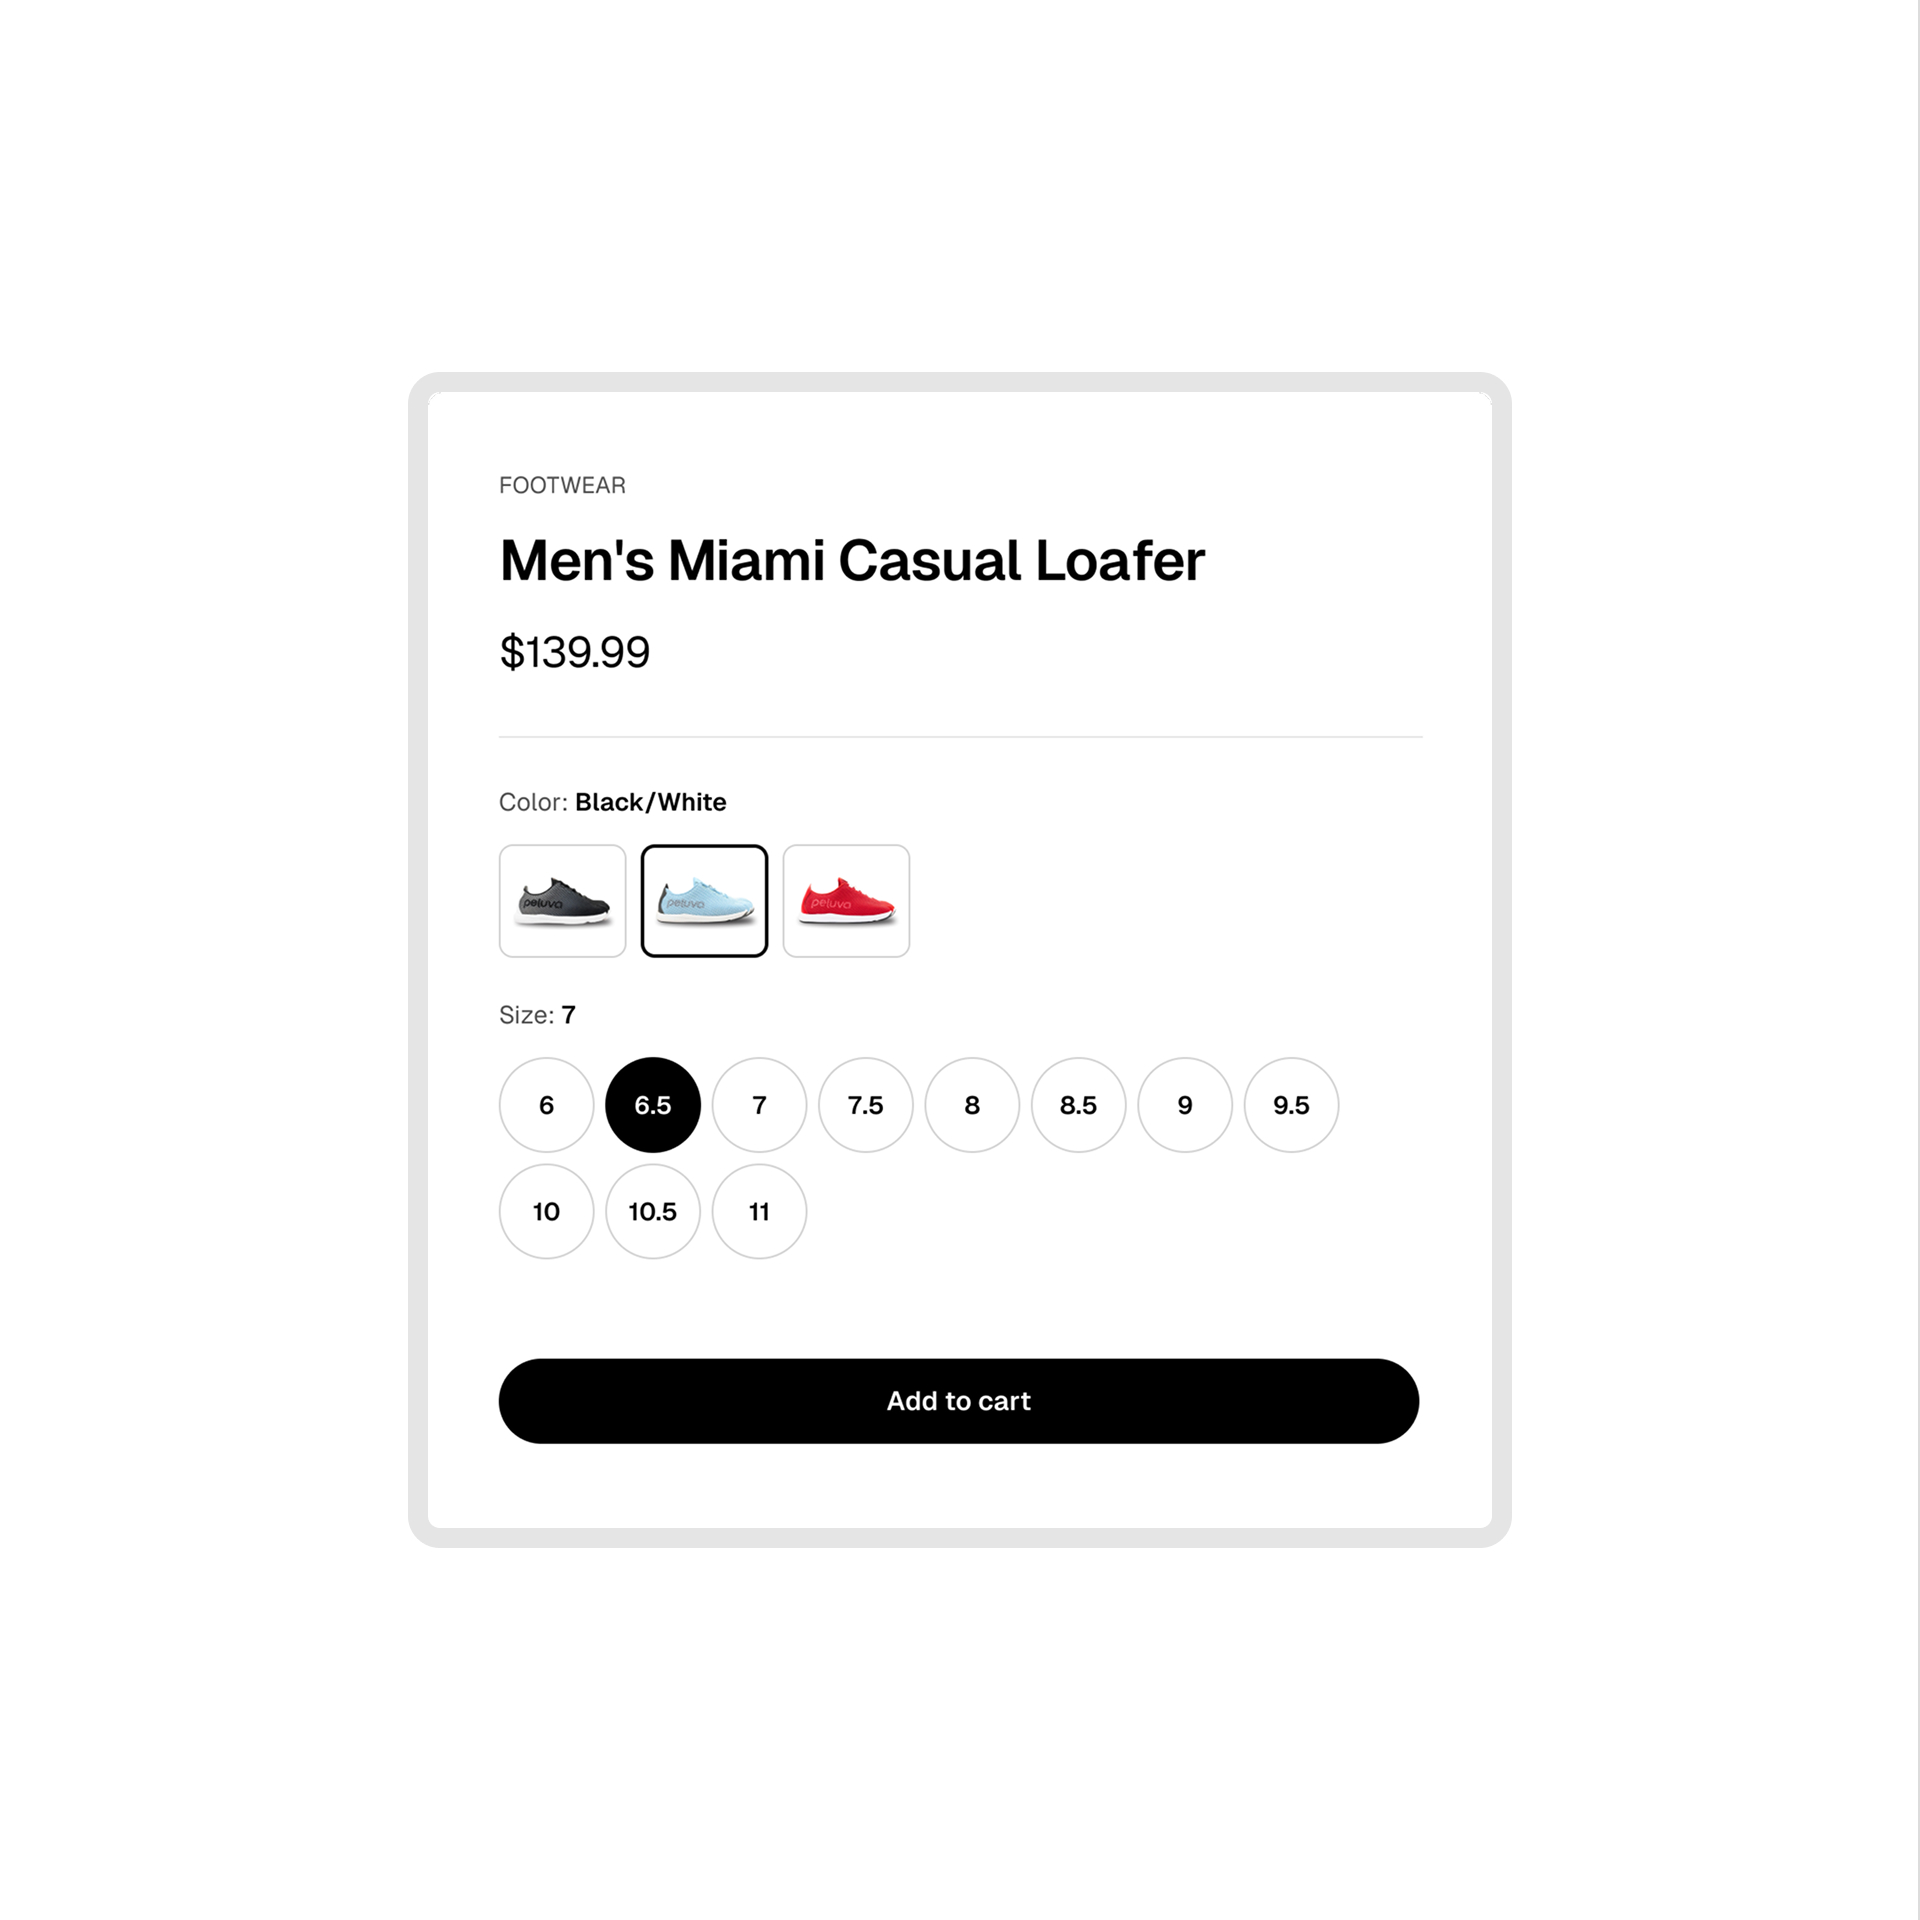
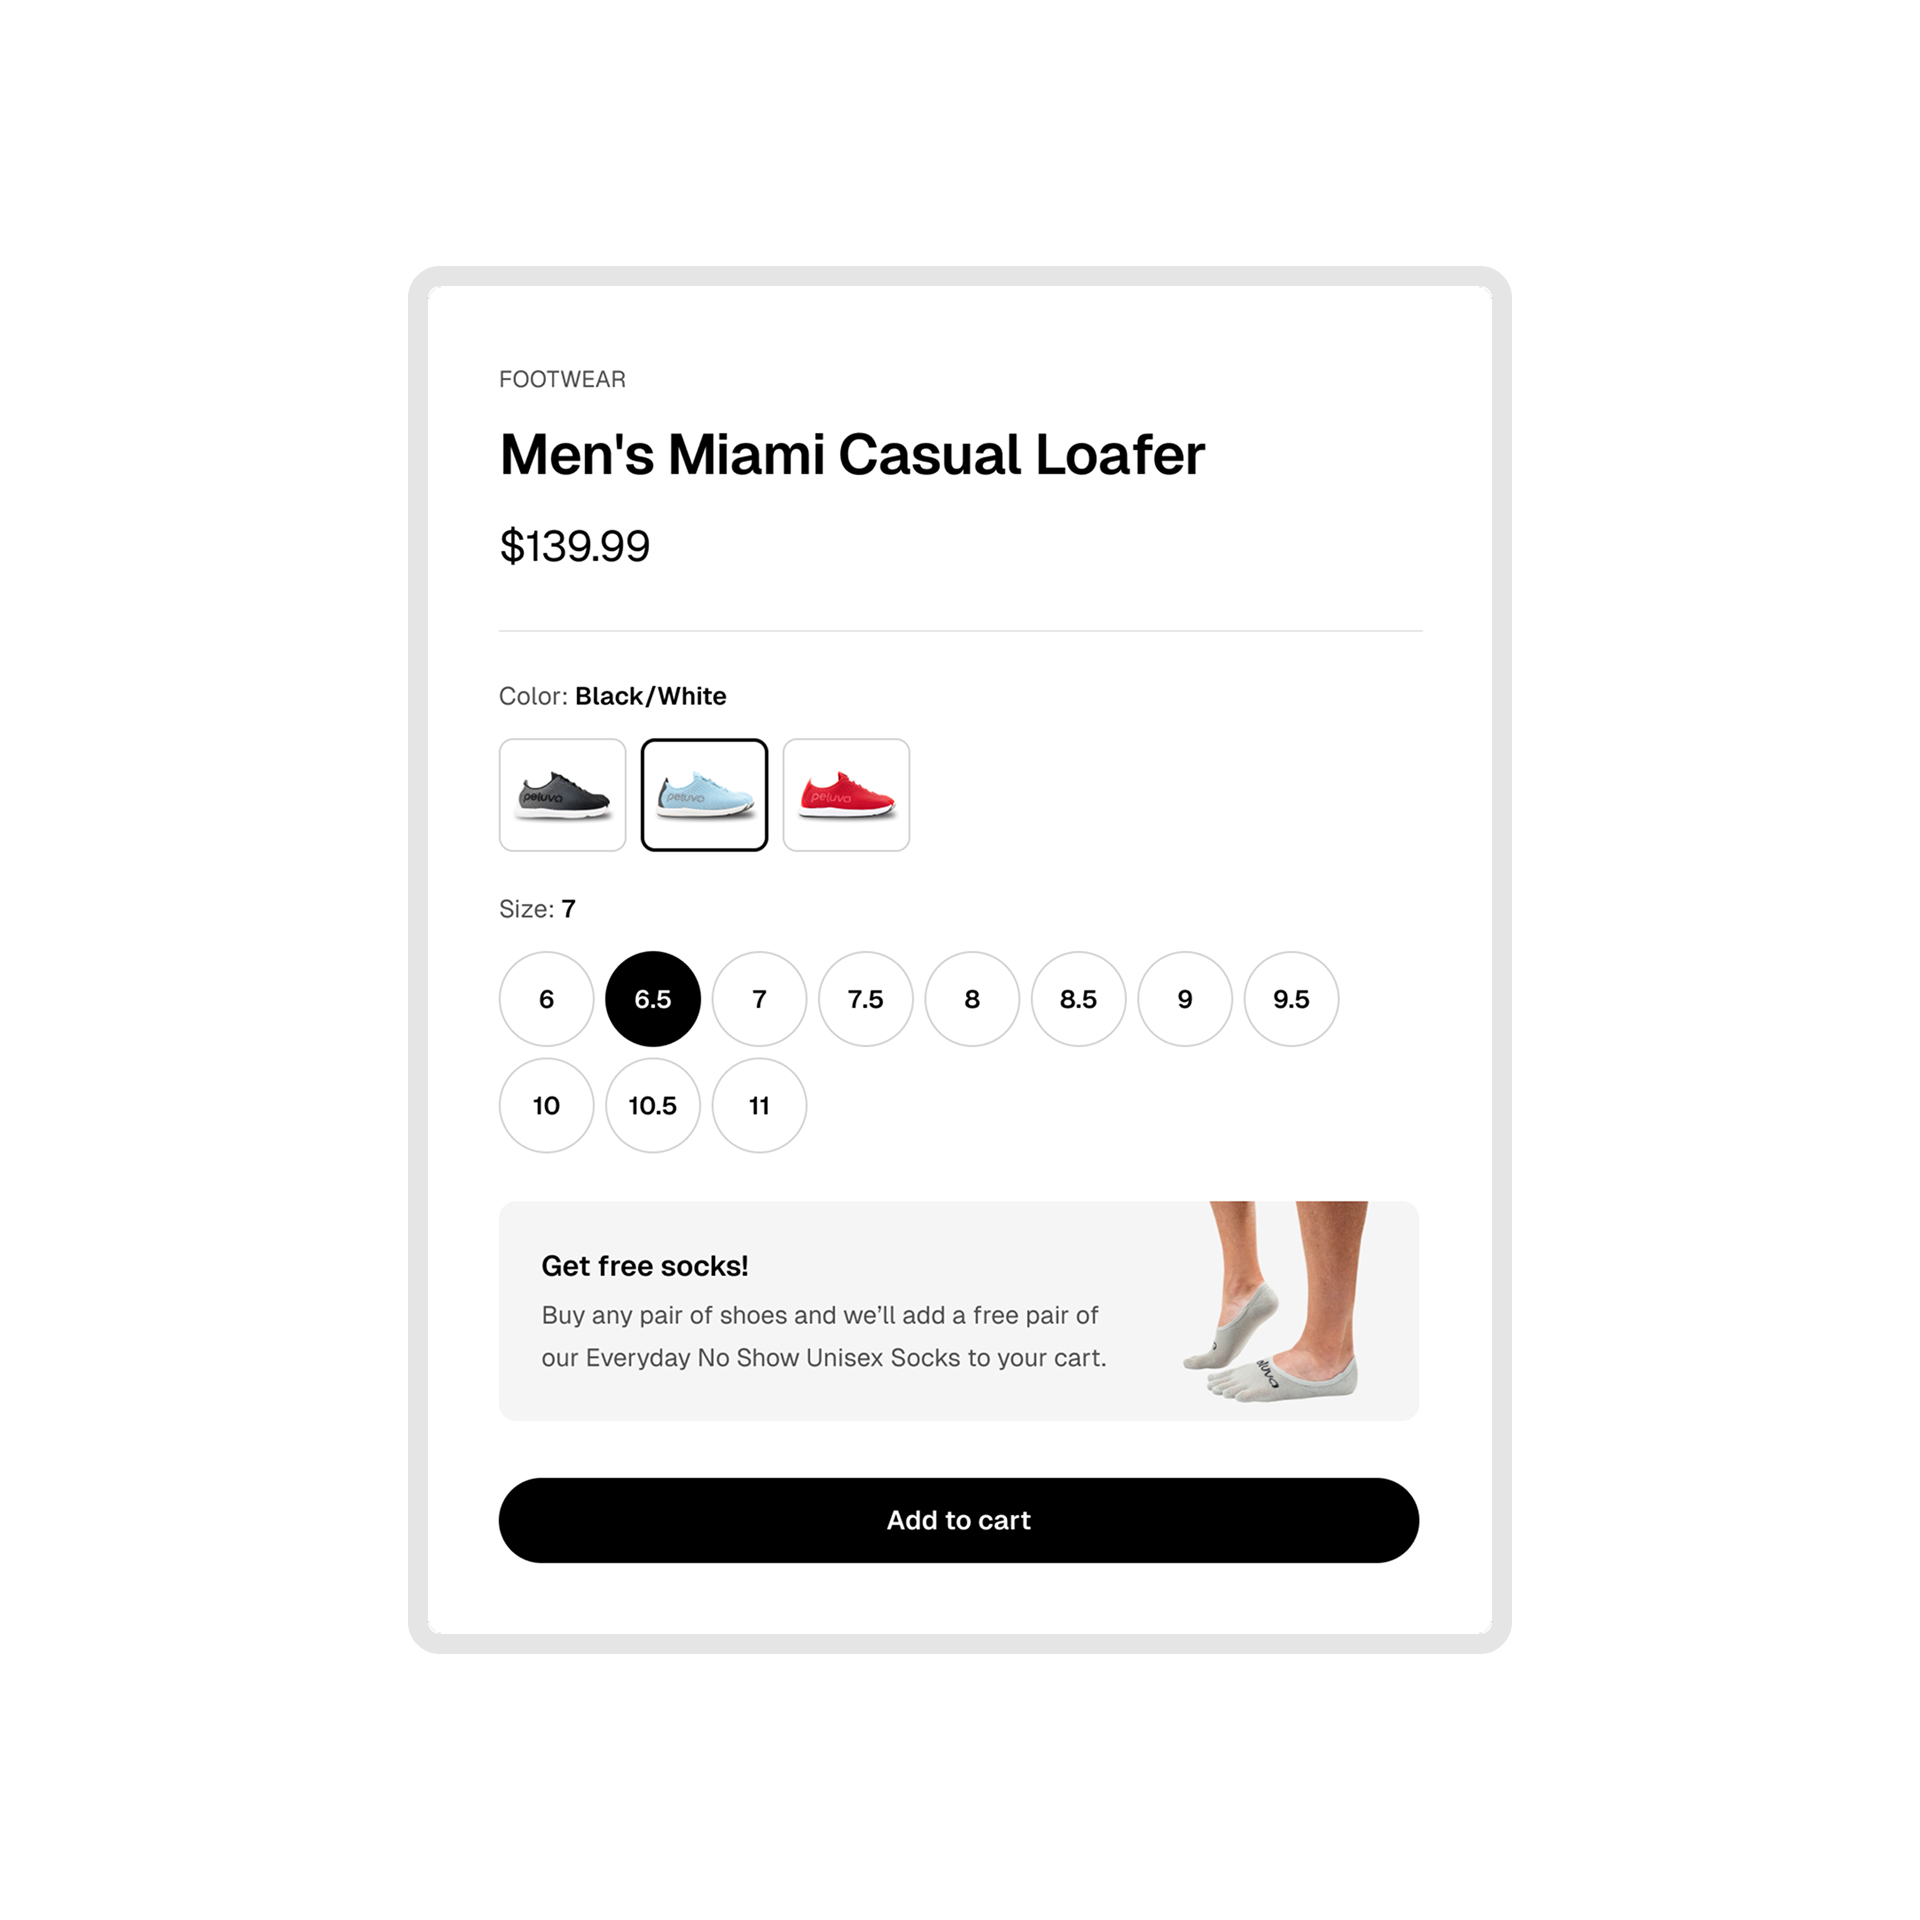
| 4 | T1 | Gift with purchase vs flat discount | Peluva | +18% RPV |
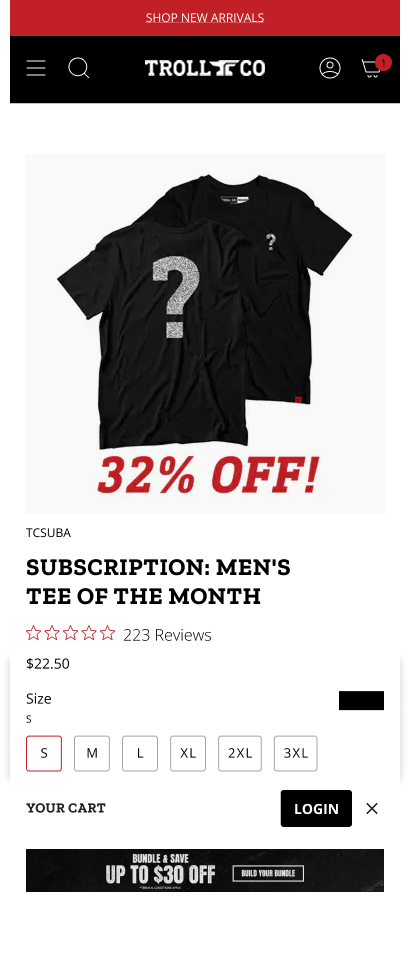
| 5 | T1 | Subscribe & save on consumables | Trollco Clothing | +9% RPV, +1.2x reorder rate |
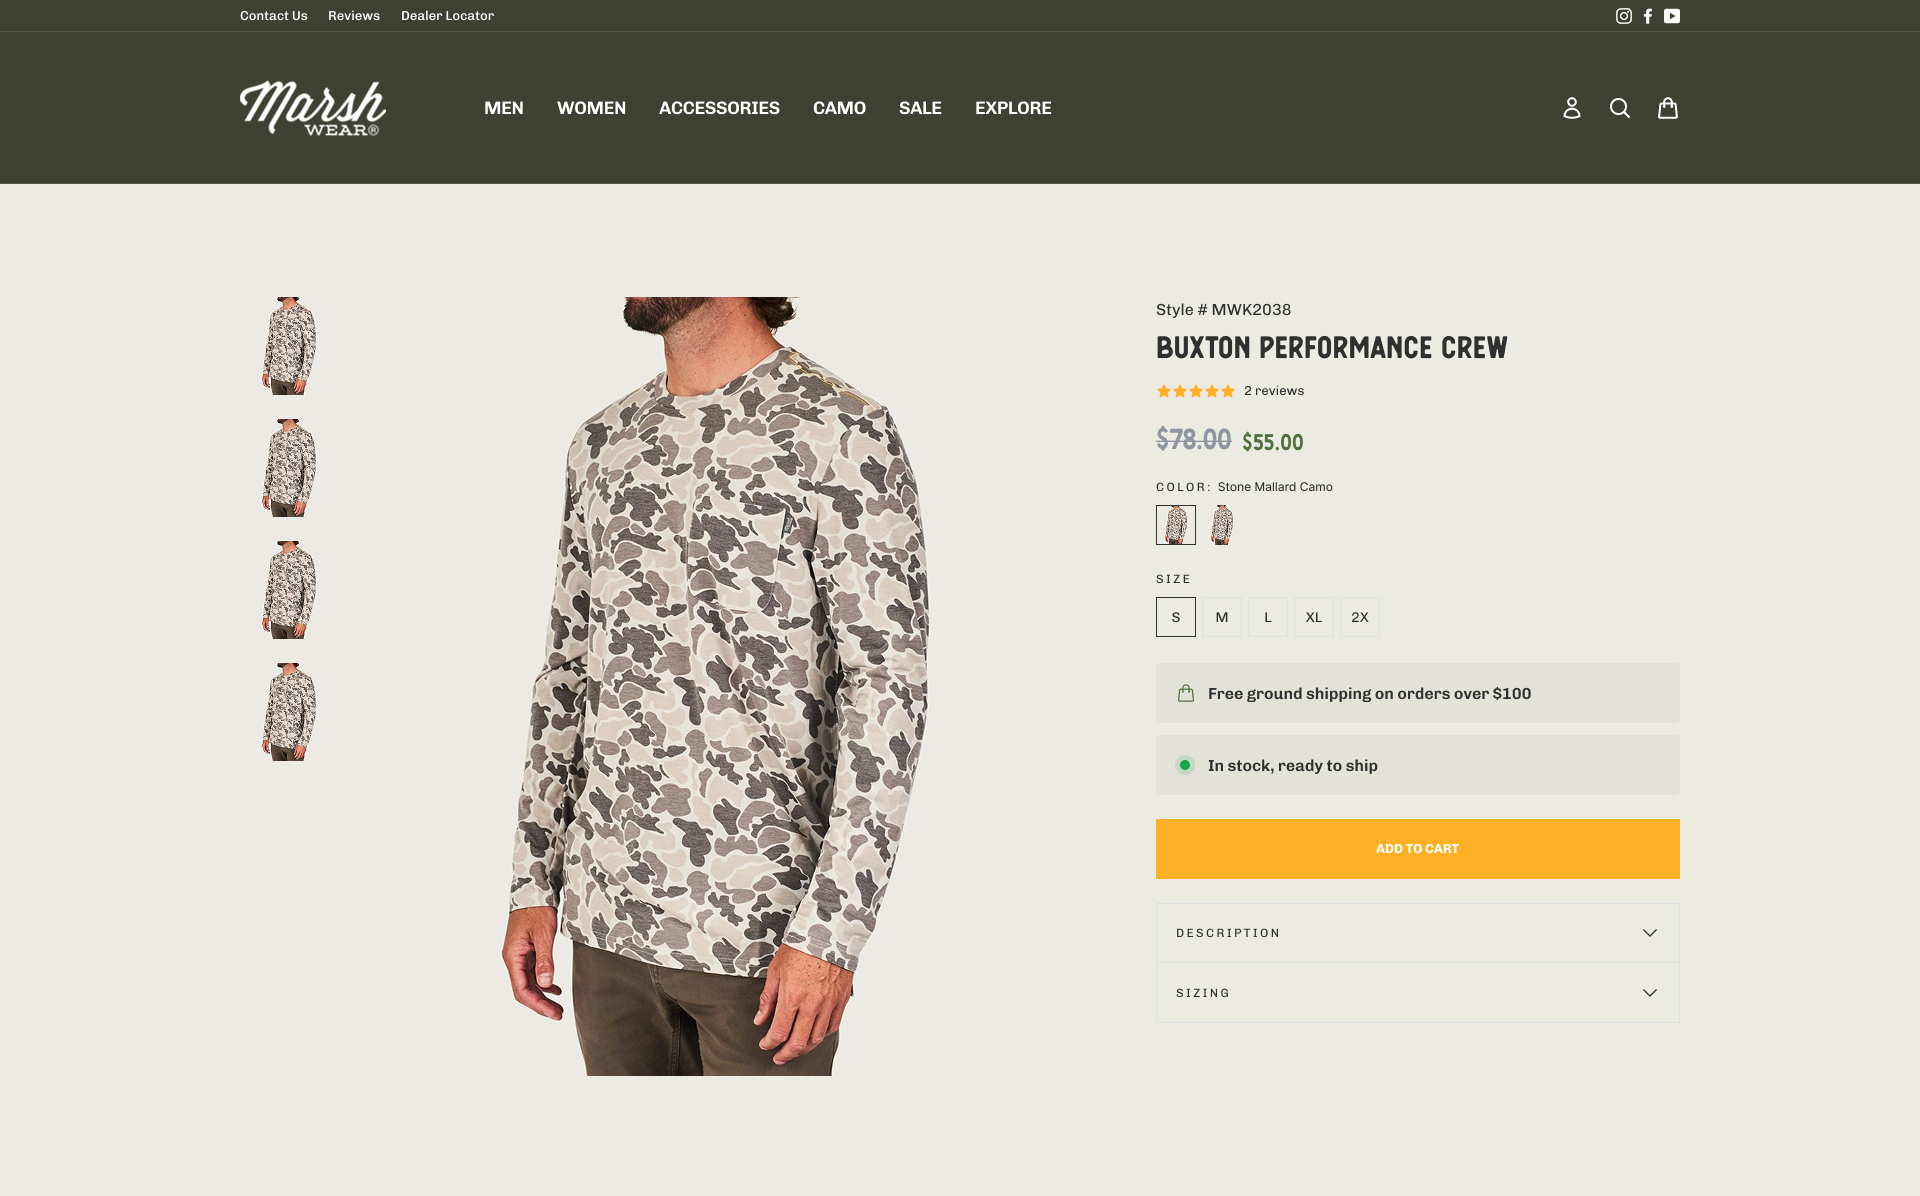
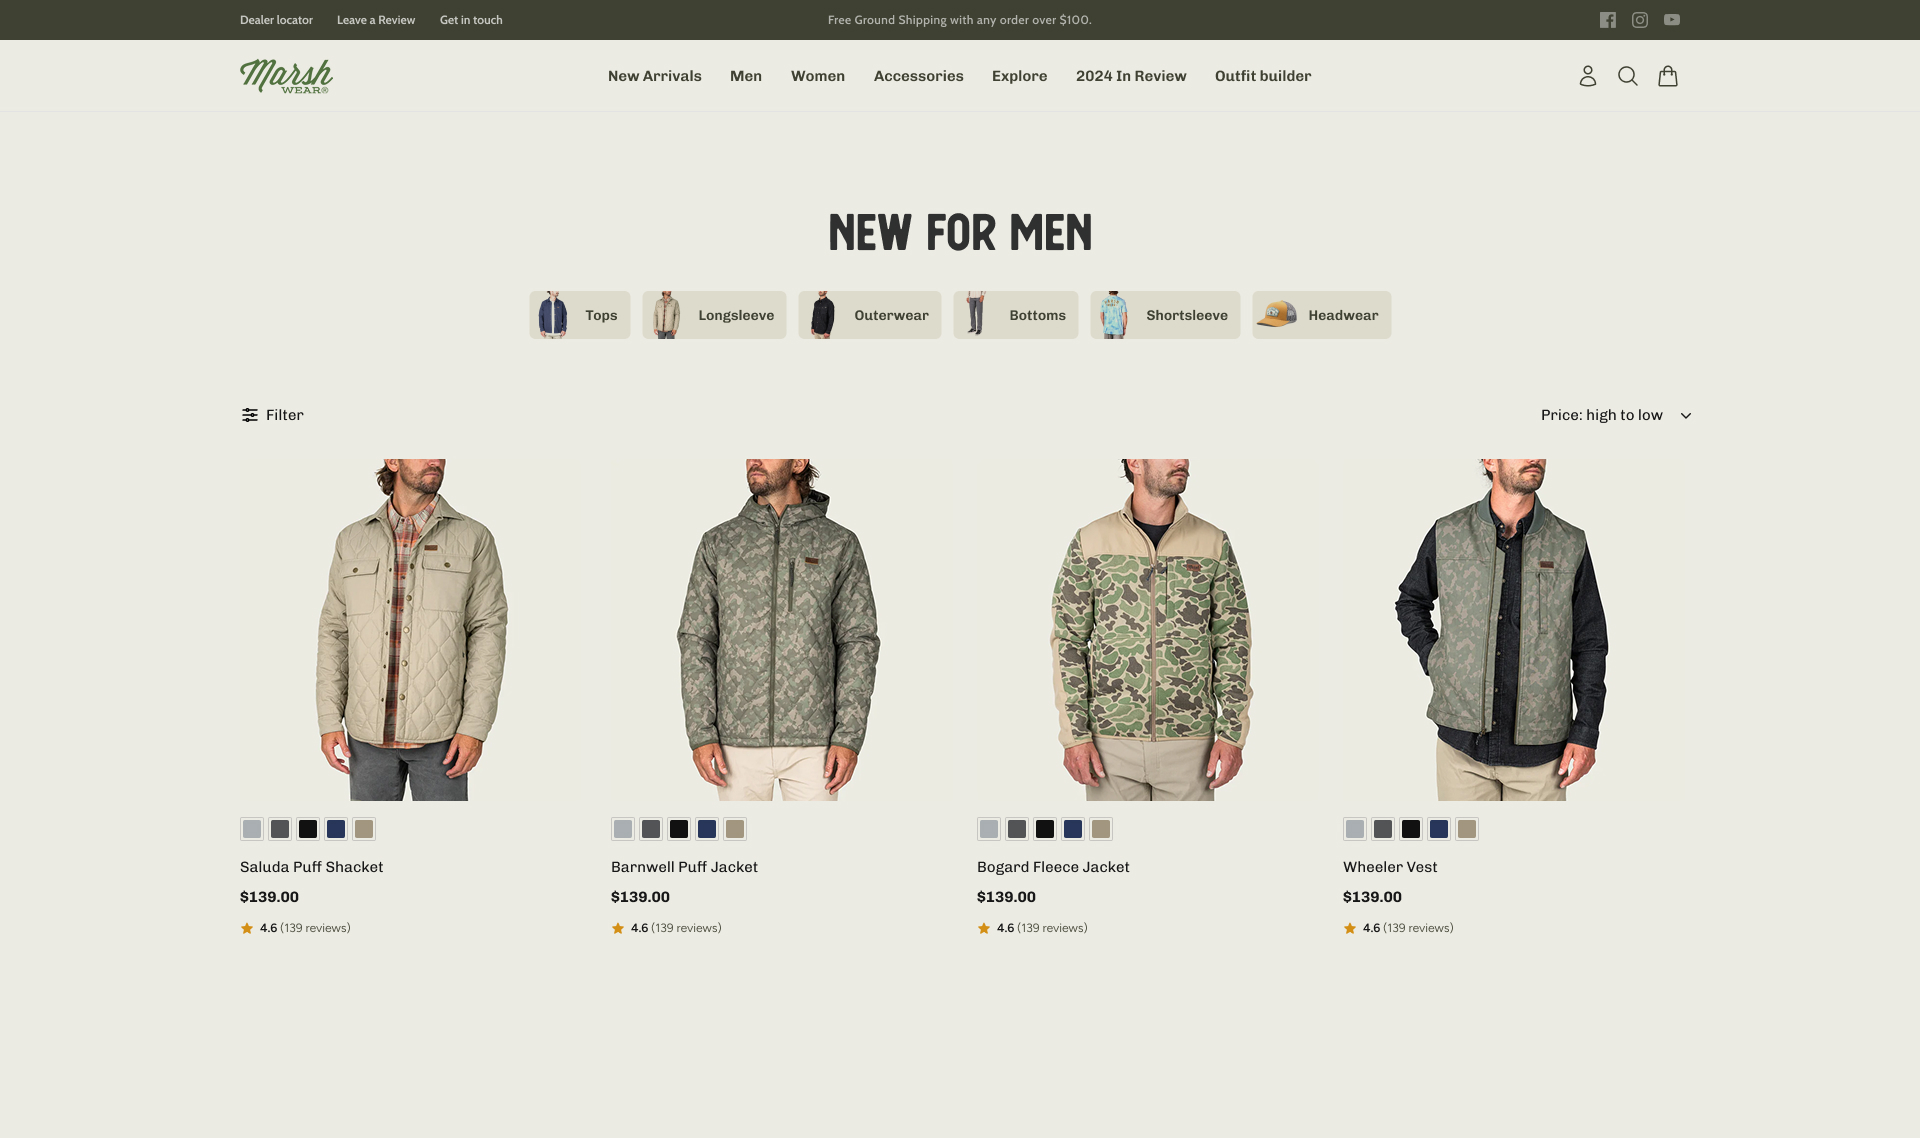
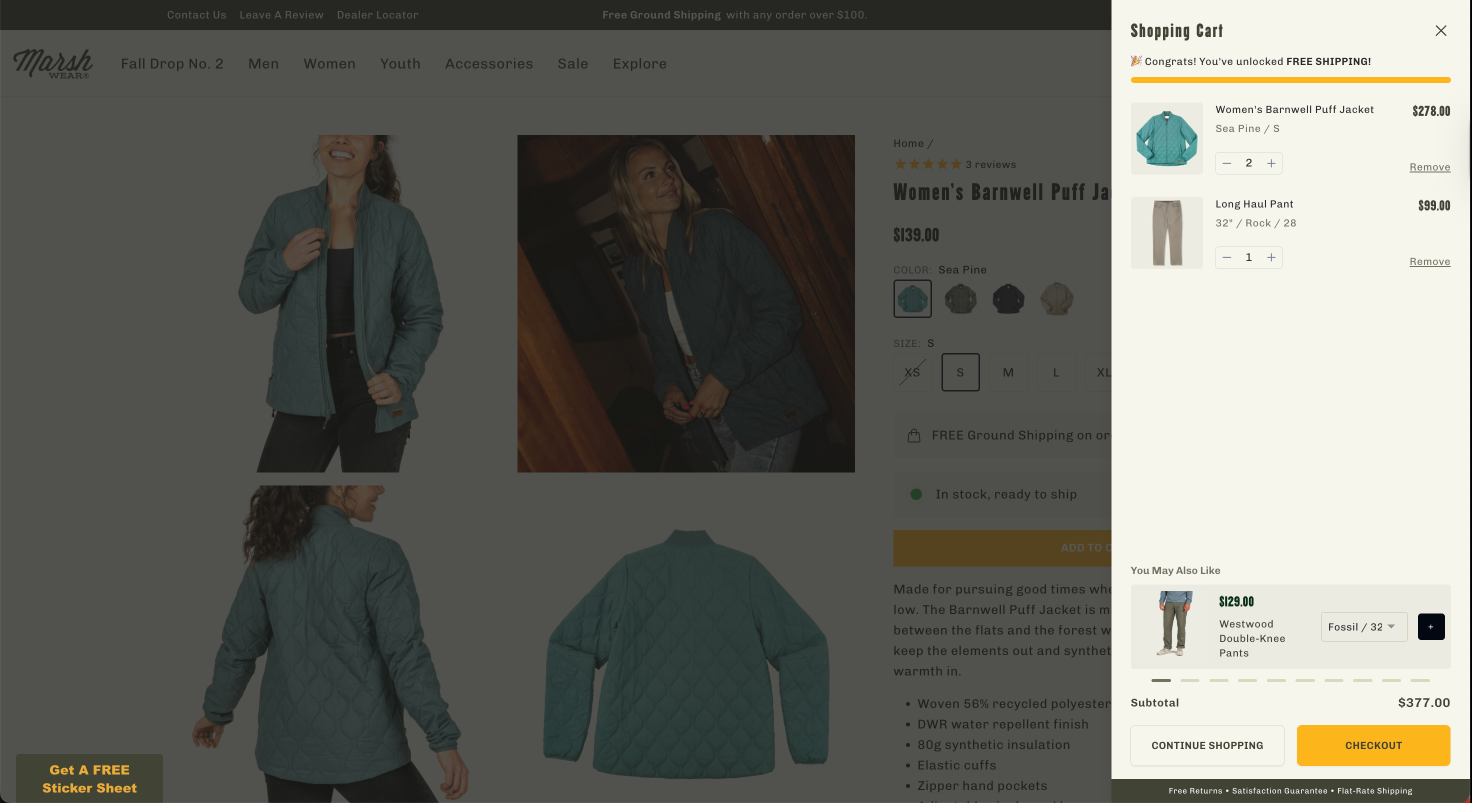
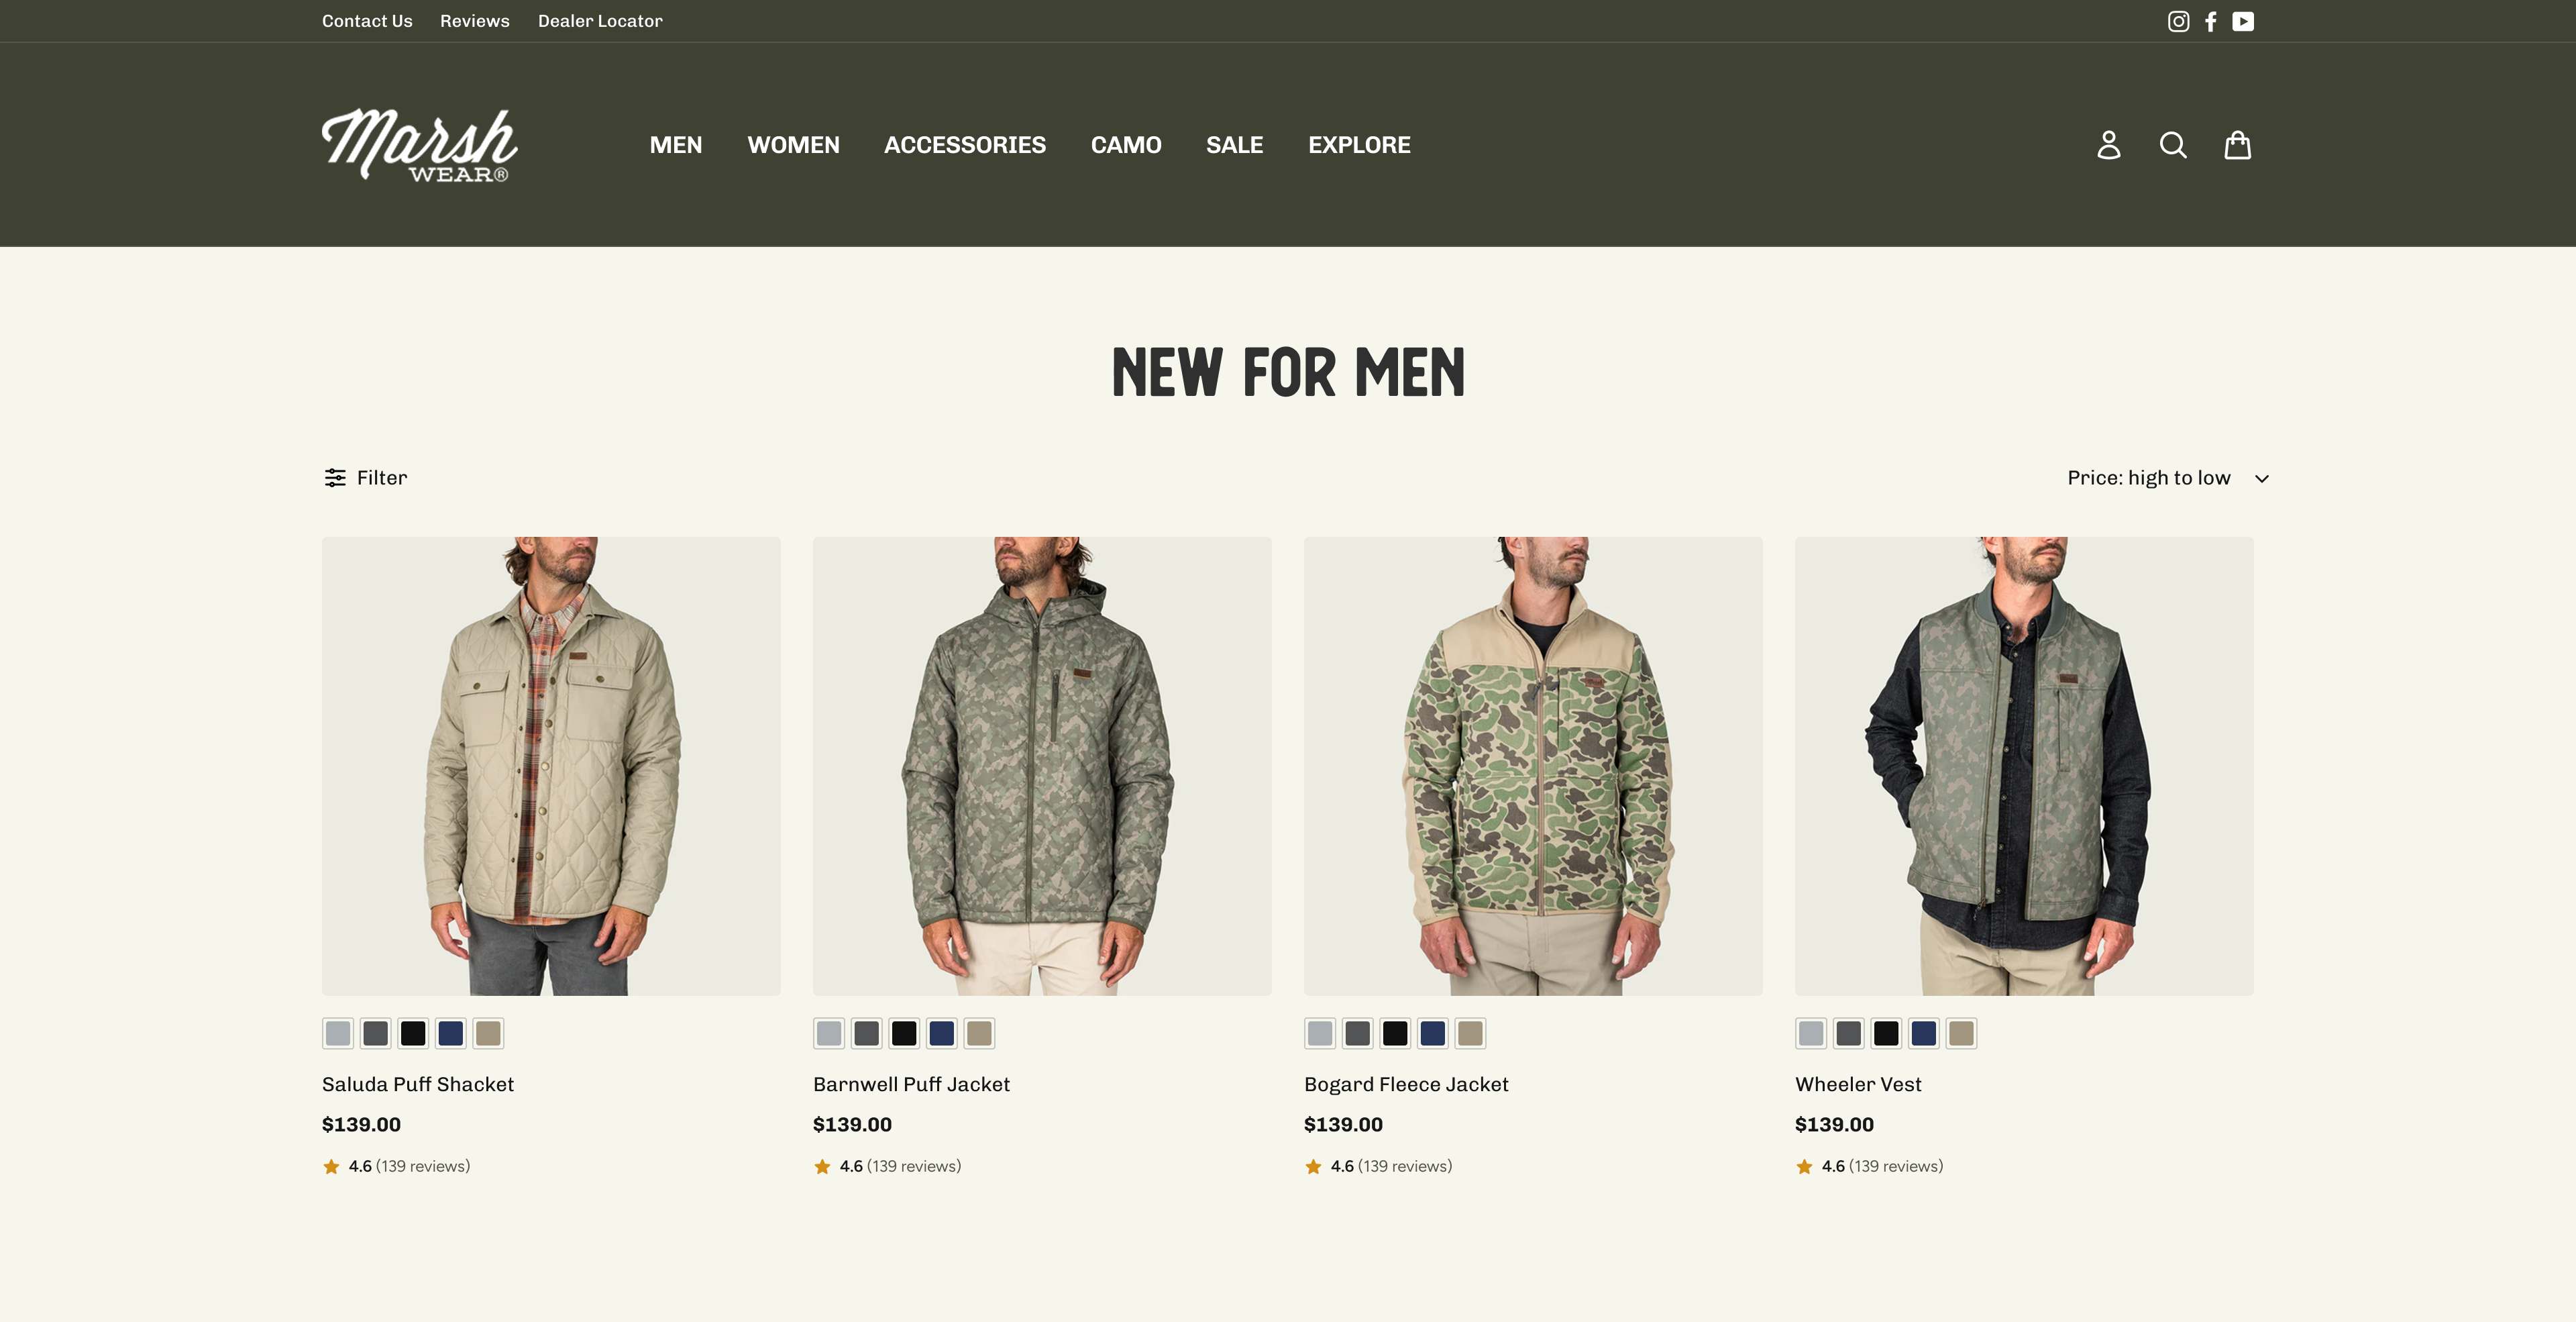
| 6 | T1 | Discount removal on flagship | Marsh Wear | +14% margin, +29% checkout rate |
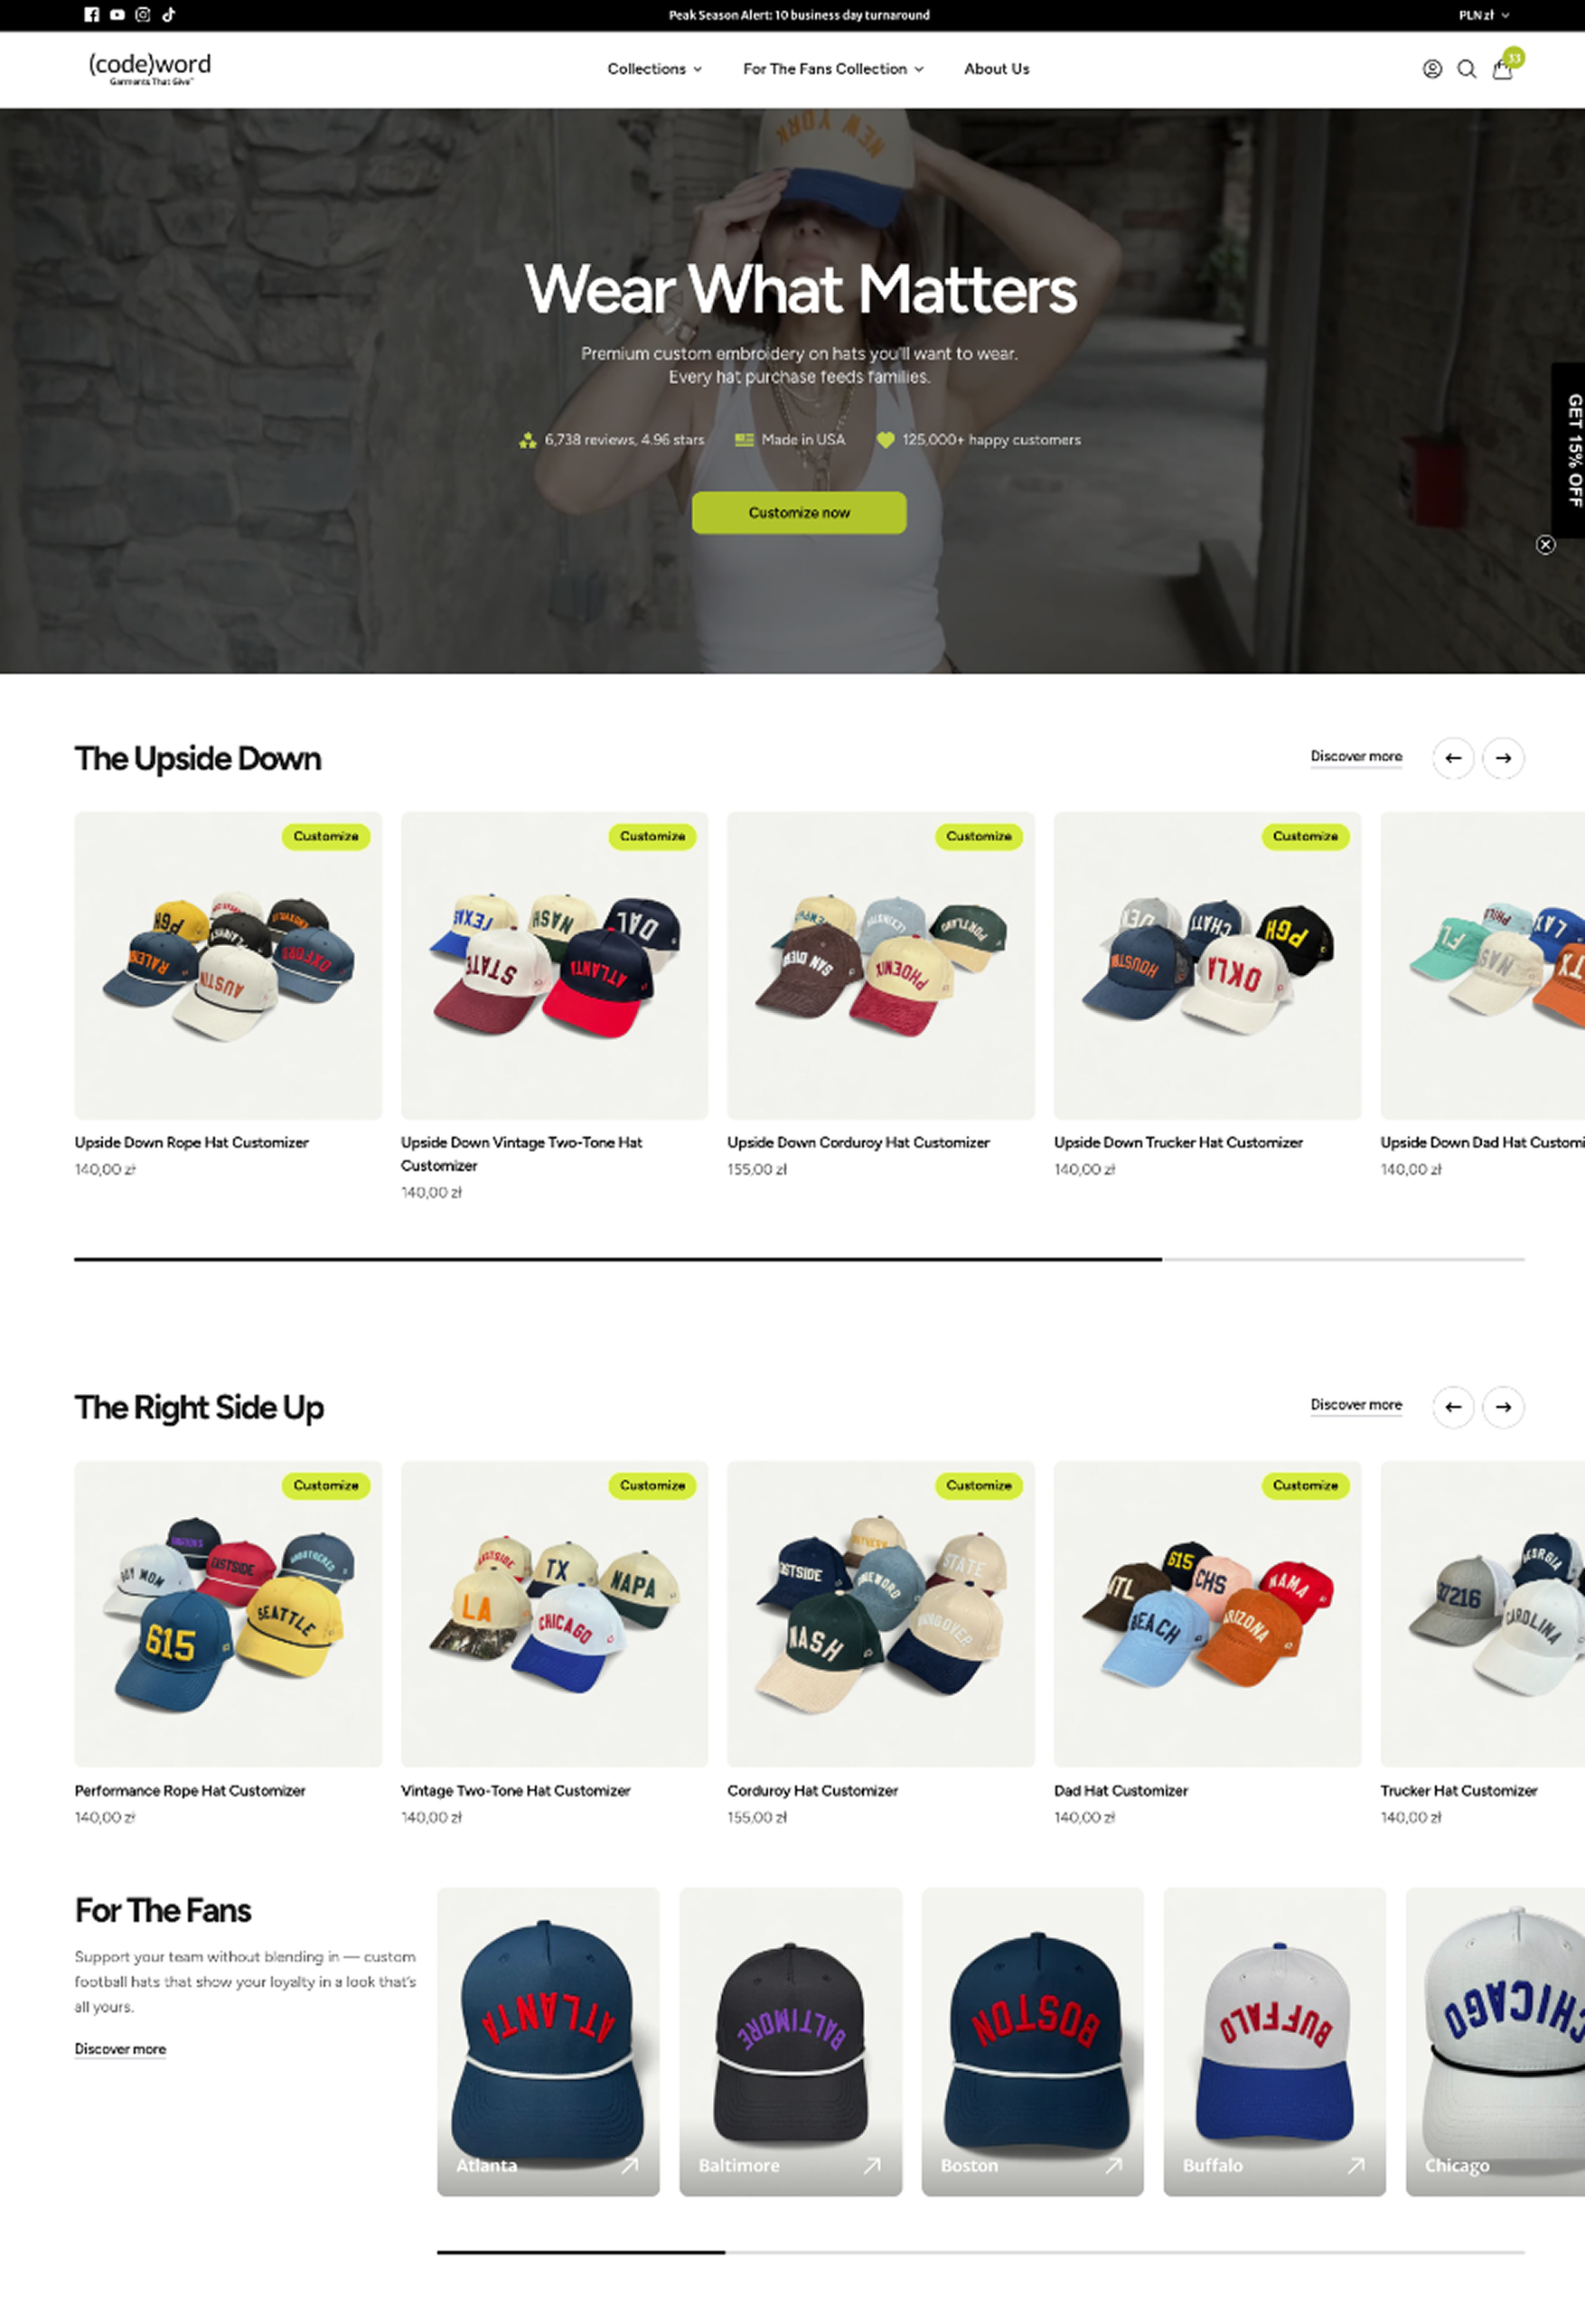
| 7 | T1 | Spend-and-save threshold tiers | Codeword | +13% AOV |
| 8 | T1 | Post-purchase one-click upsell | HashStash | +16% AOV, 14% acceptance rate |
| 9 | T1 | Starter kit for new customers | Marsh Wear | +17% new visitor CVR |
| 10 | T1 | Volume discount incentive in cart | Marsh Wear | +21% RPV |
| 11 | T2 | Desktop sticky navbar | AFTCO | +5% RPV |
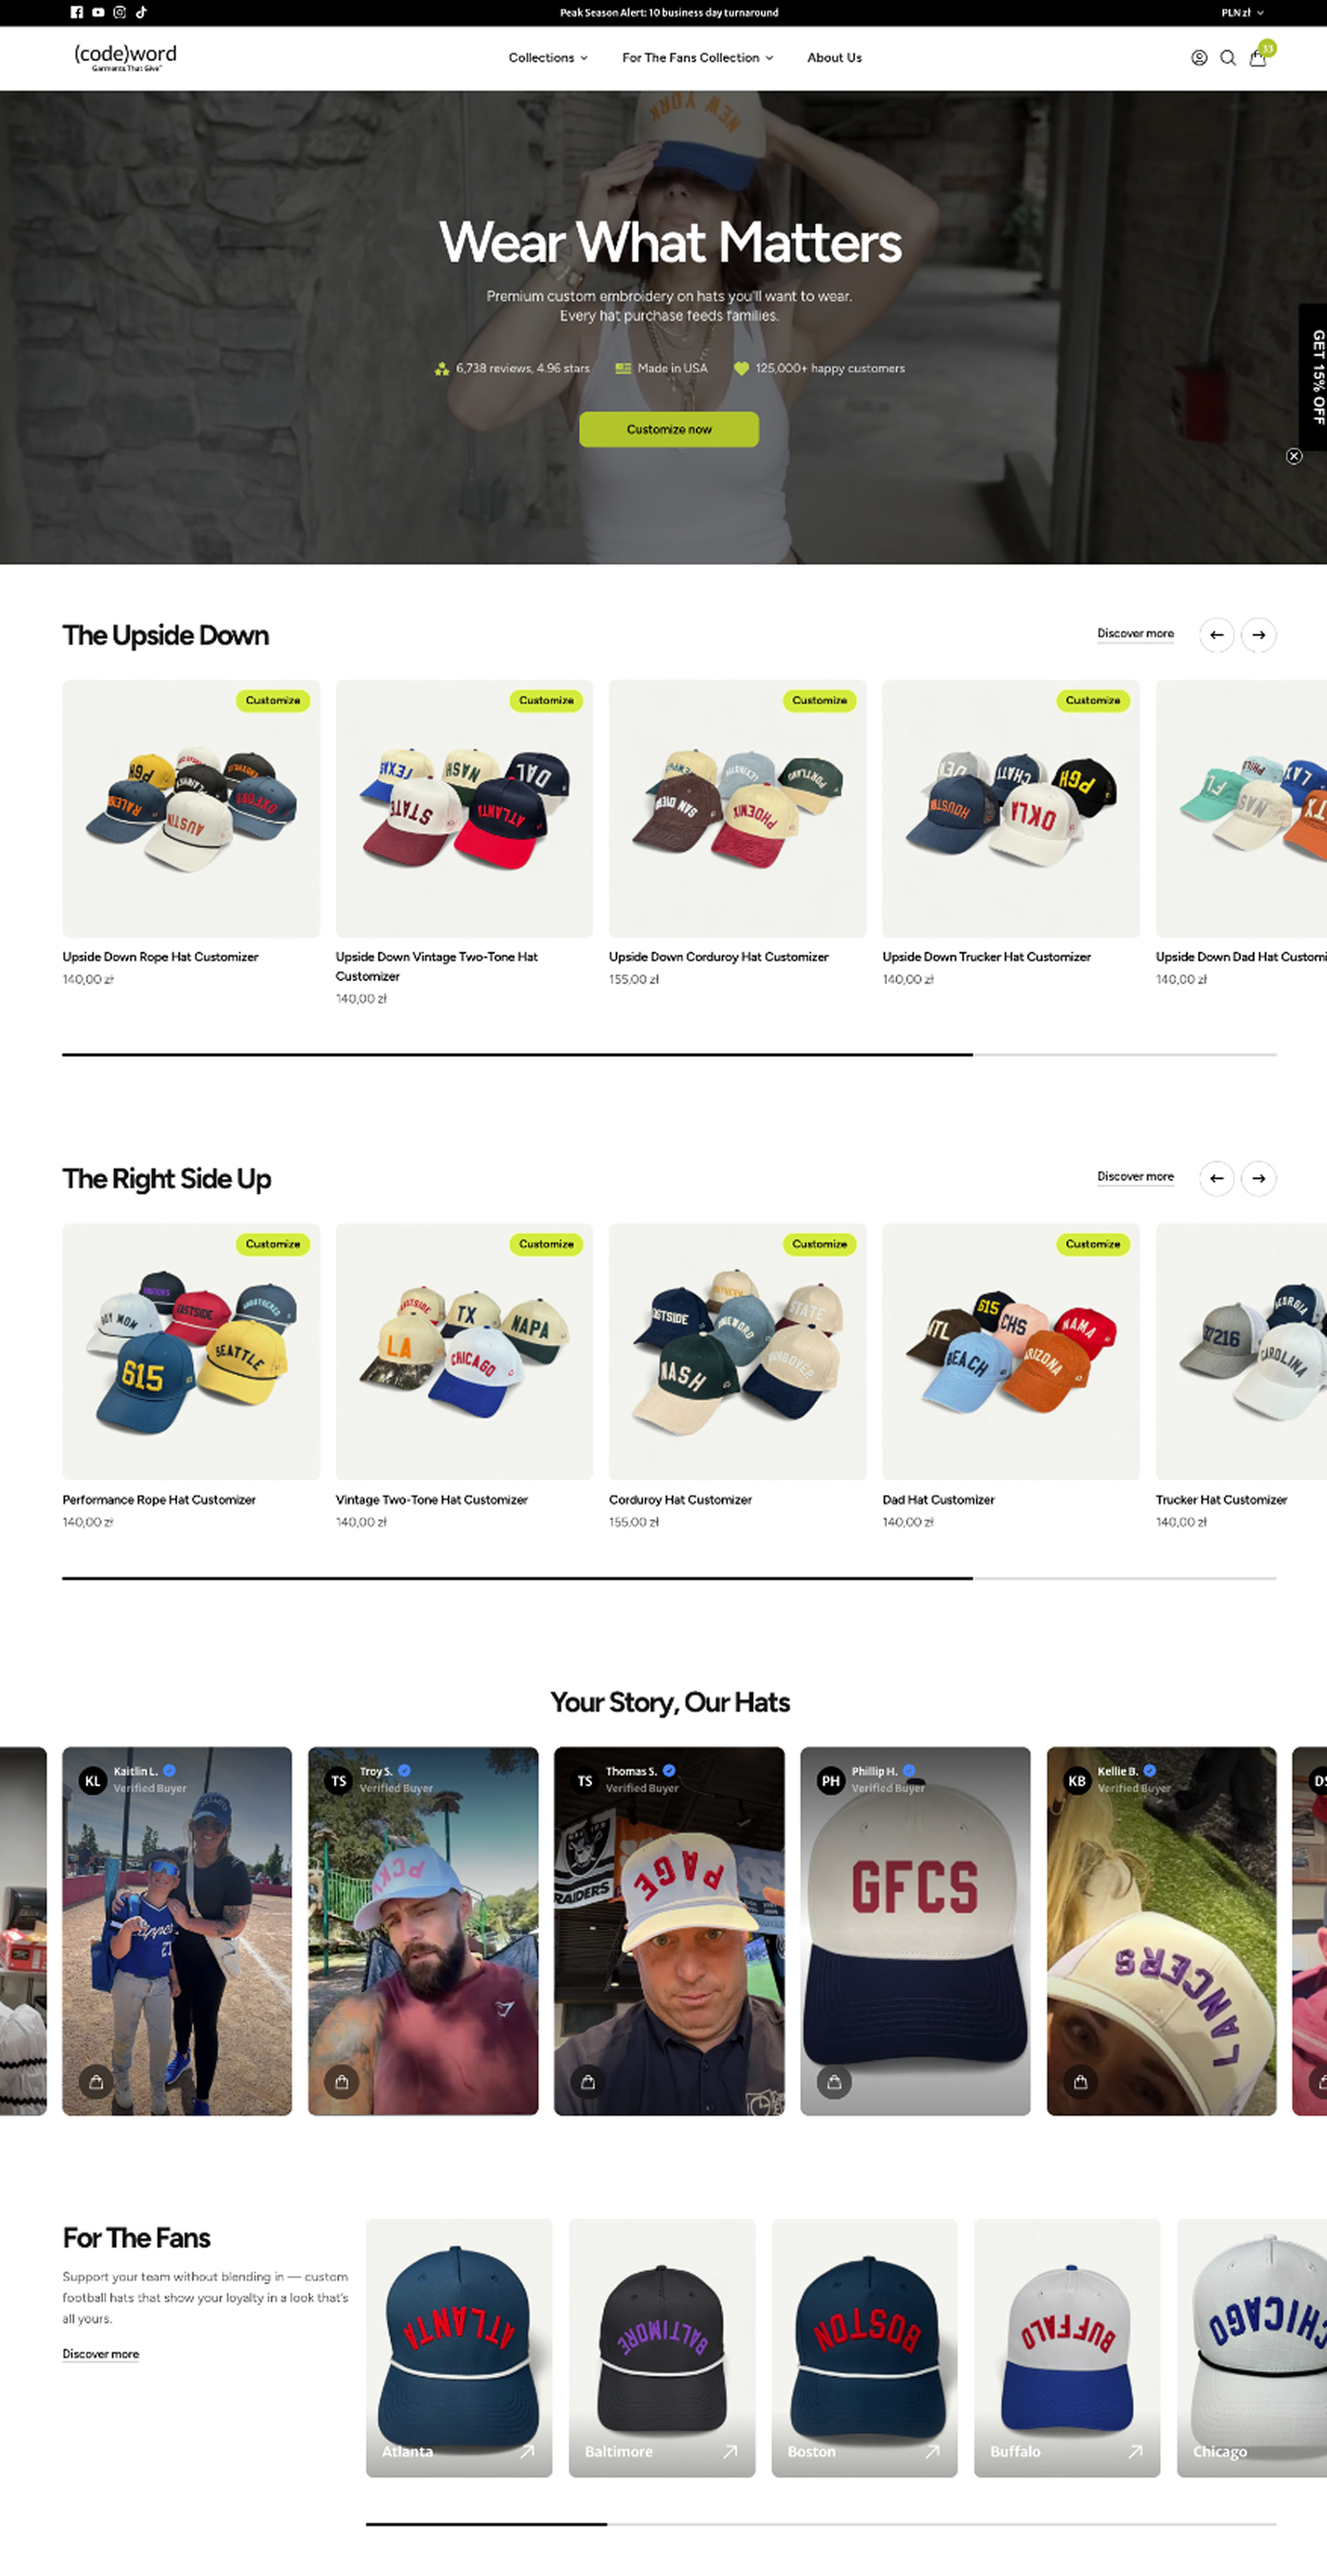
| 12 | T2 | Homepage UGC carousel | Codeword | +5% CVR, -8% bounce |
| 13 | T2 | Cross-sell pop-up at add-to-cart | Marsh Wear | +15% RPV, +7% AOV |
| 14 | T2 | Free gift callout on PDP | Peluva | +14% RPV |
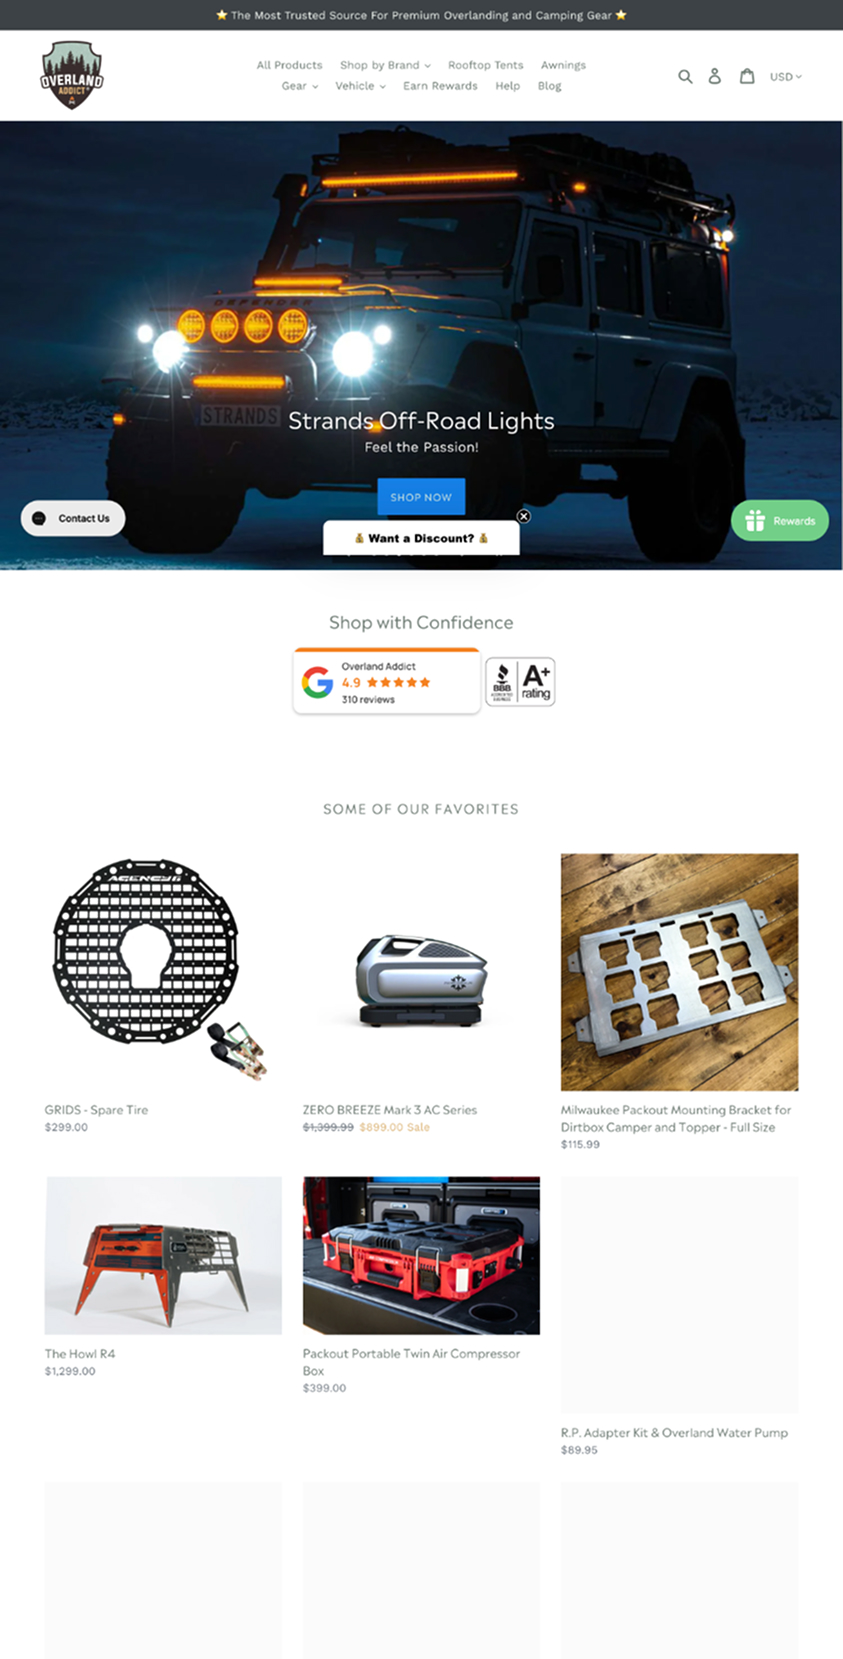
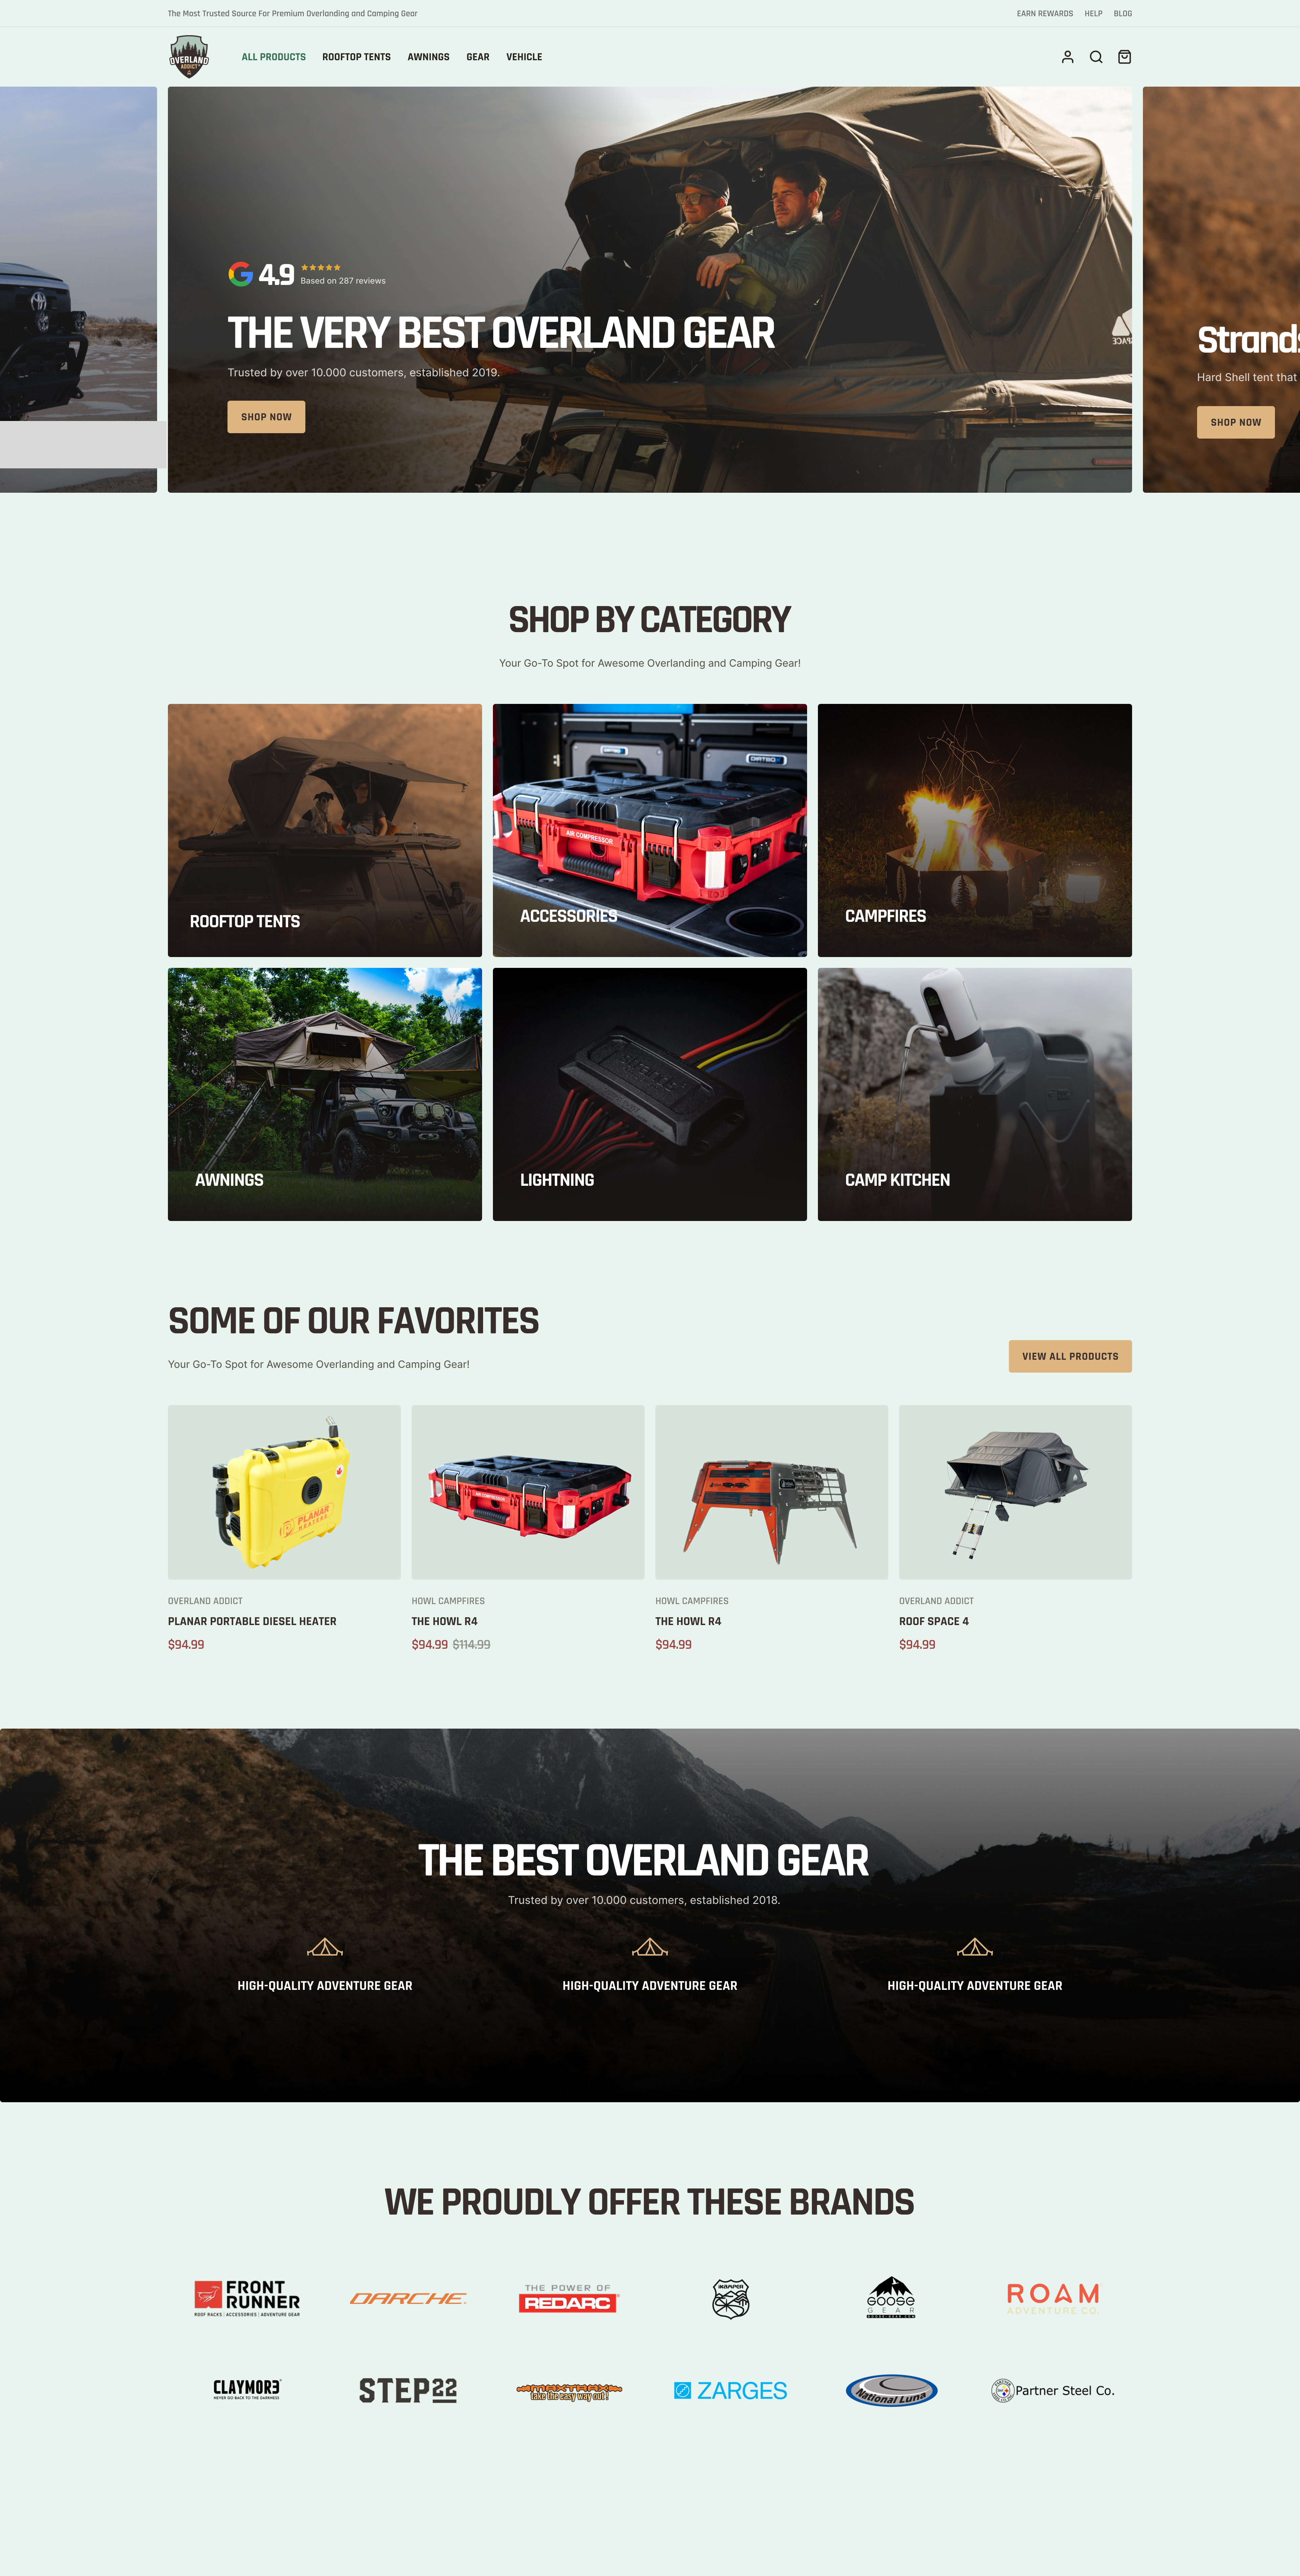
| 15 | T2 | Homepage reskin with category cards | Overland Addict | +45% CVR |
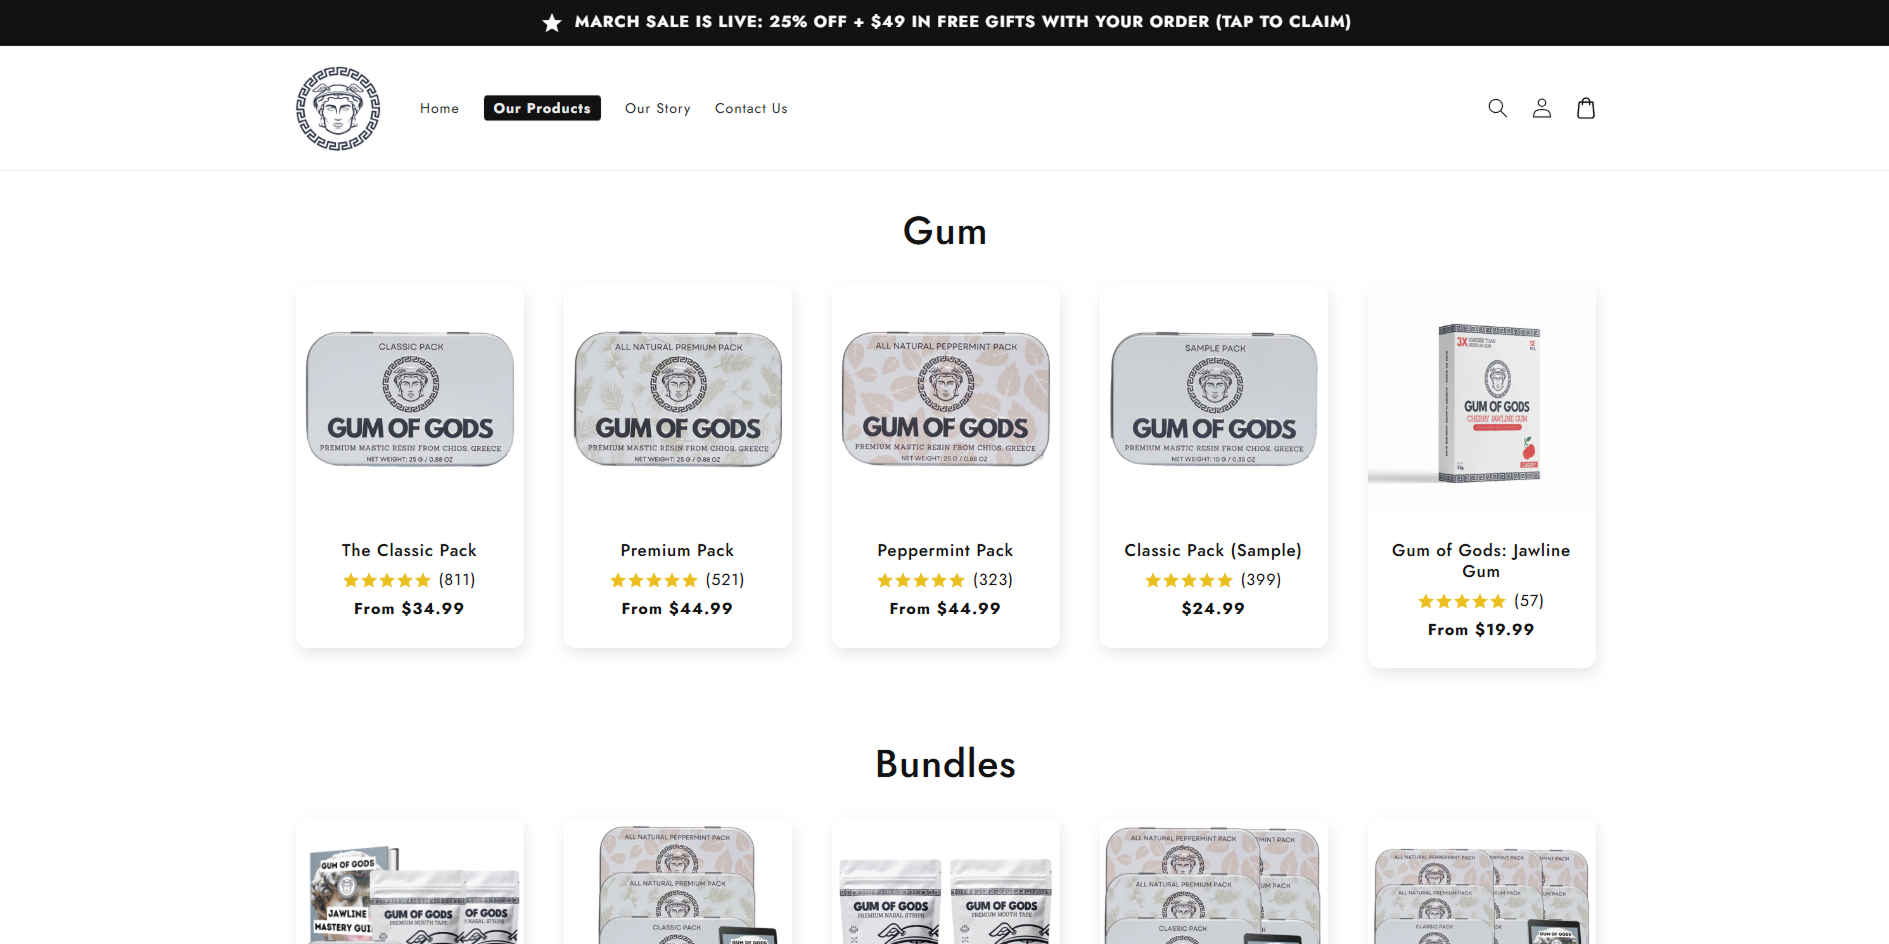
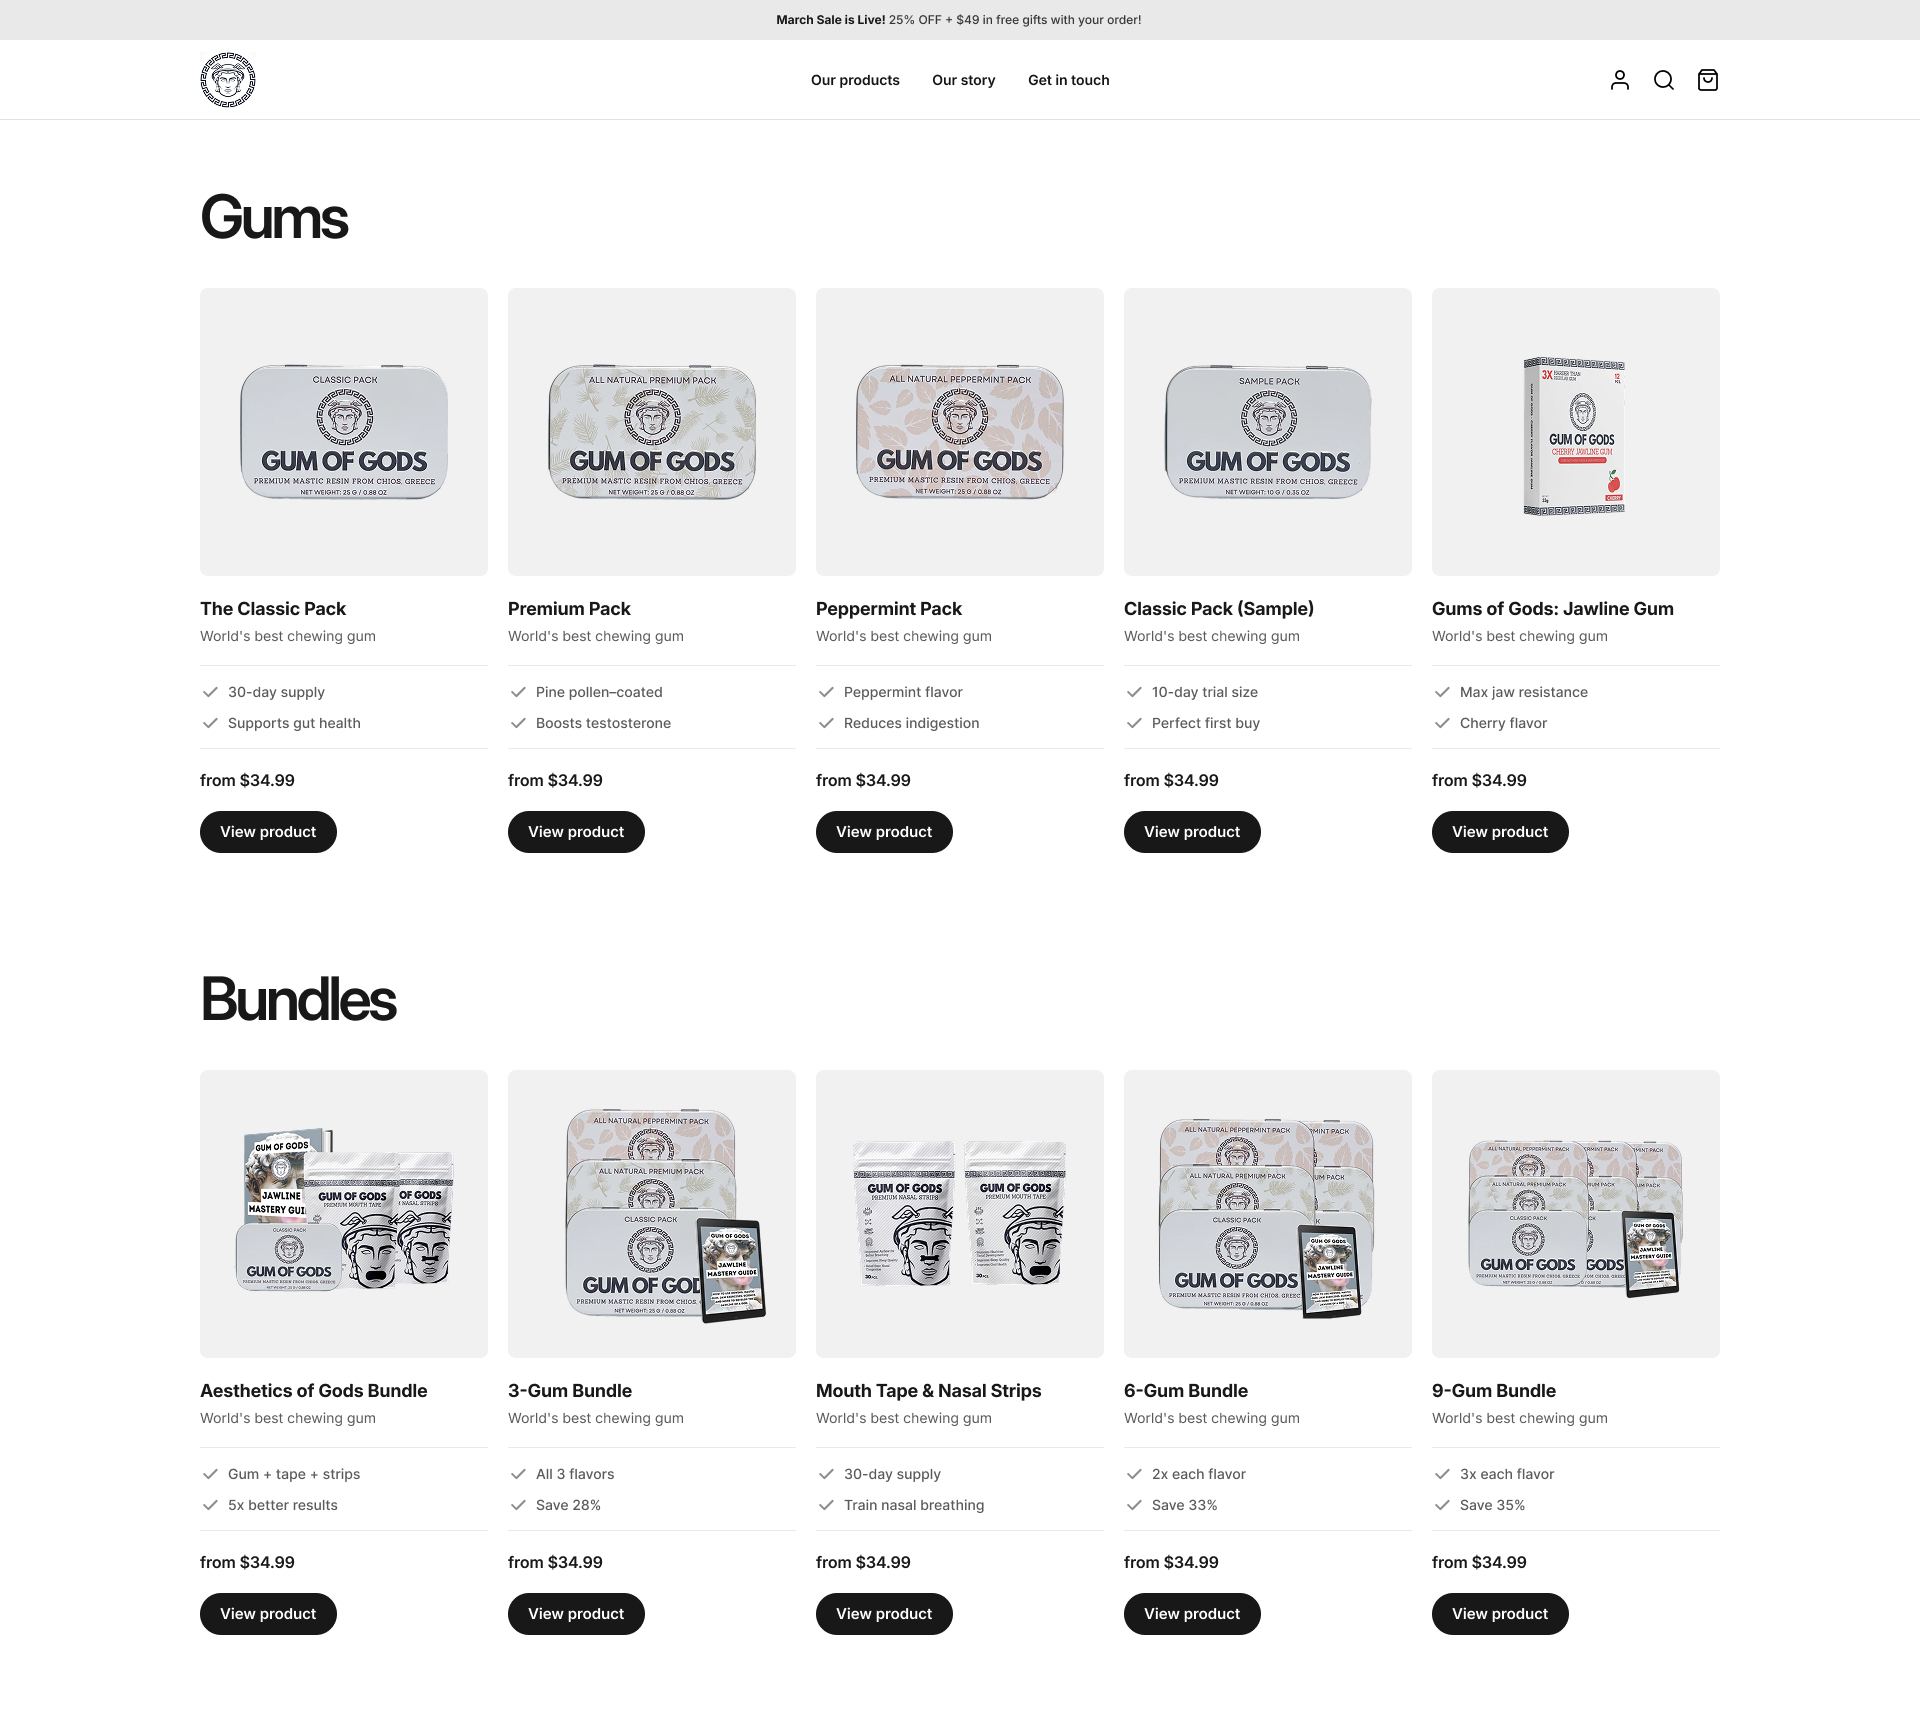
| 16 | T2 | Product card differentiation | Gum of Gods | +9% CVR |
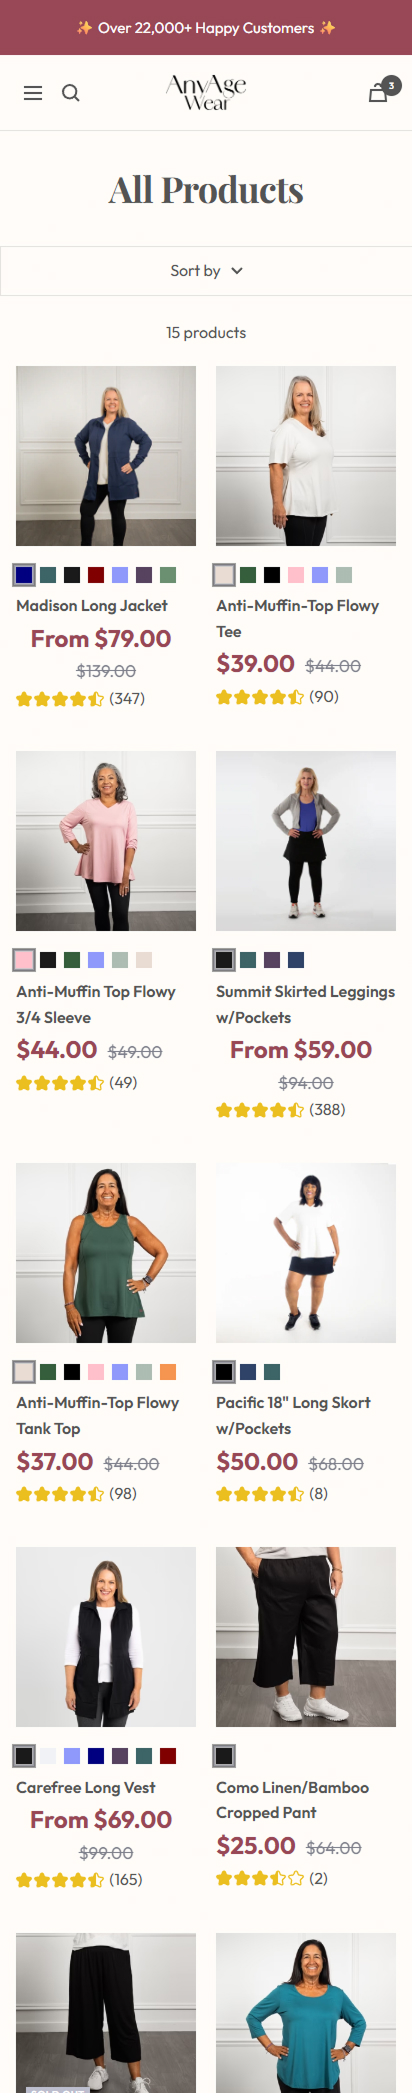
| 17 | T2 | Single column collection layout | AnyAge Wear | +3% ATC rate |
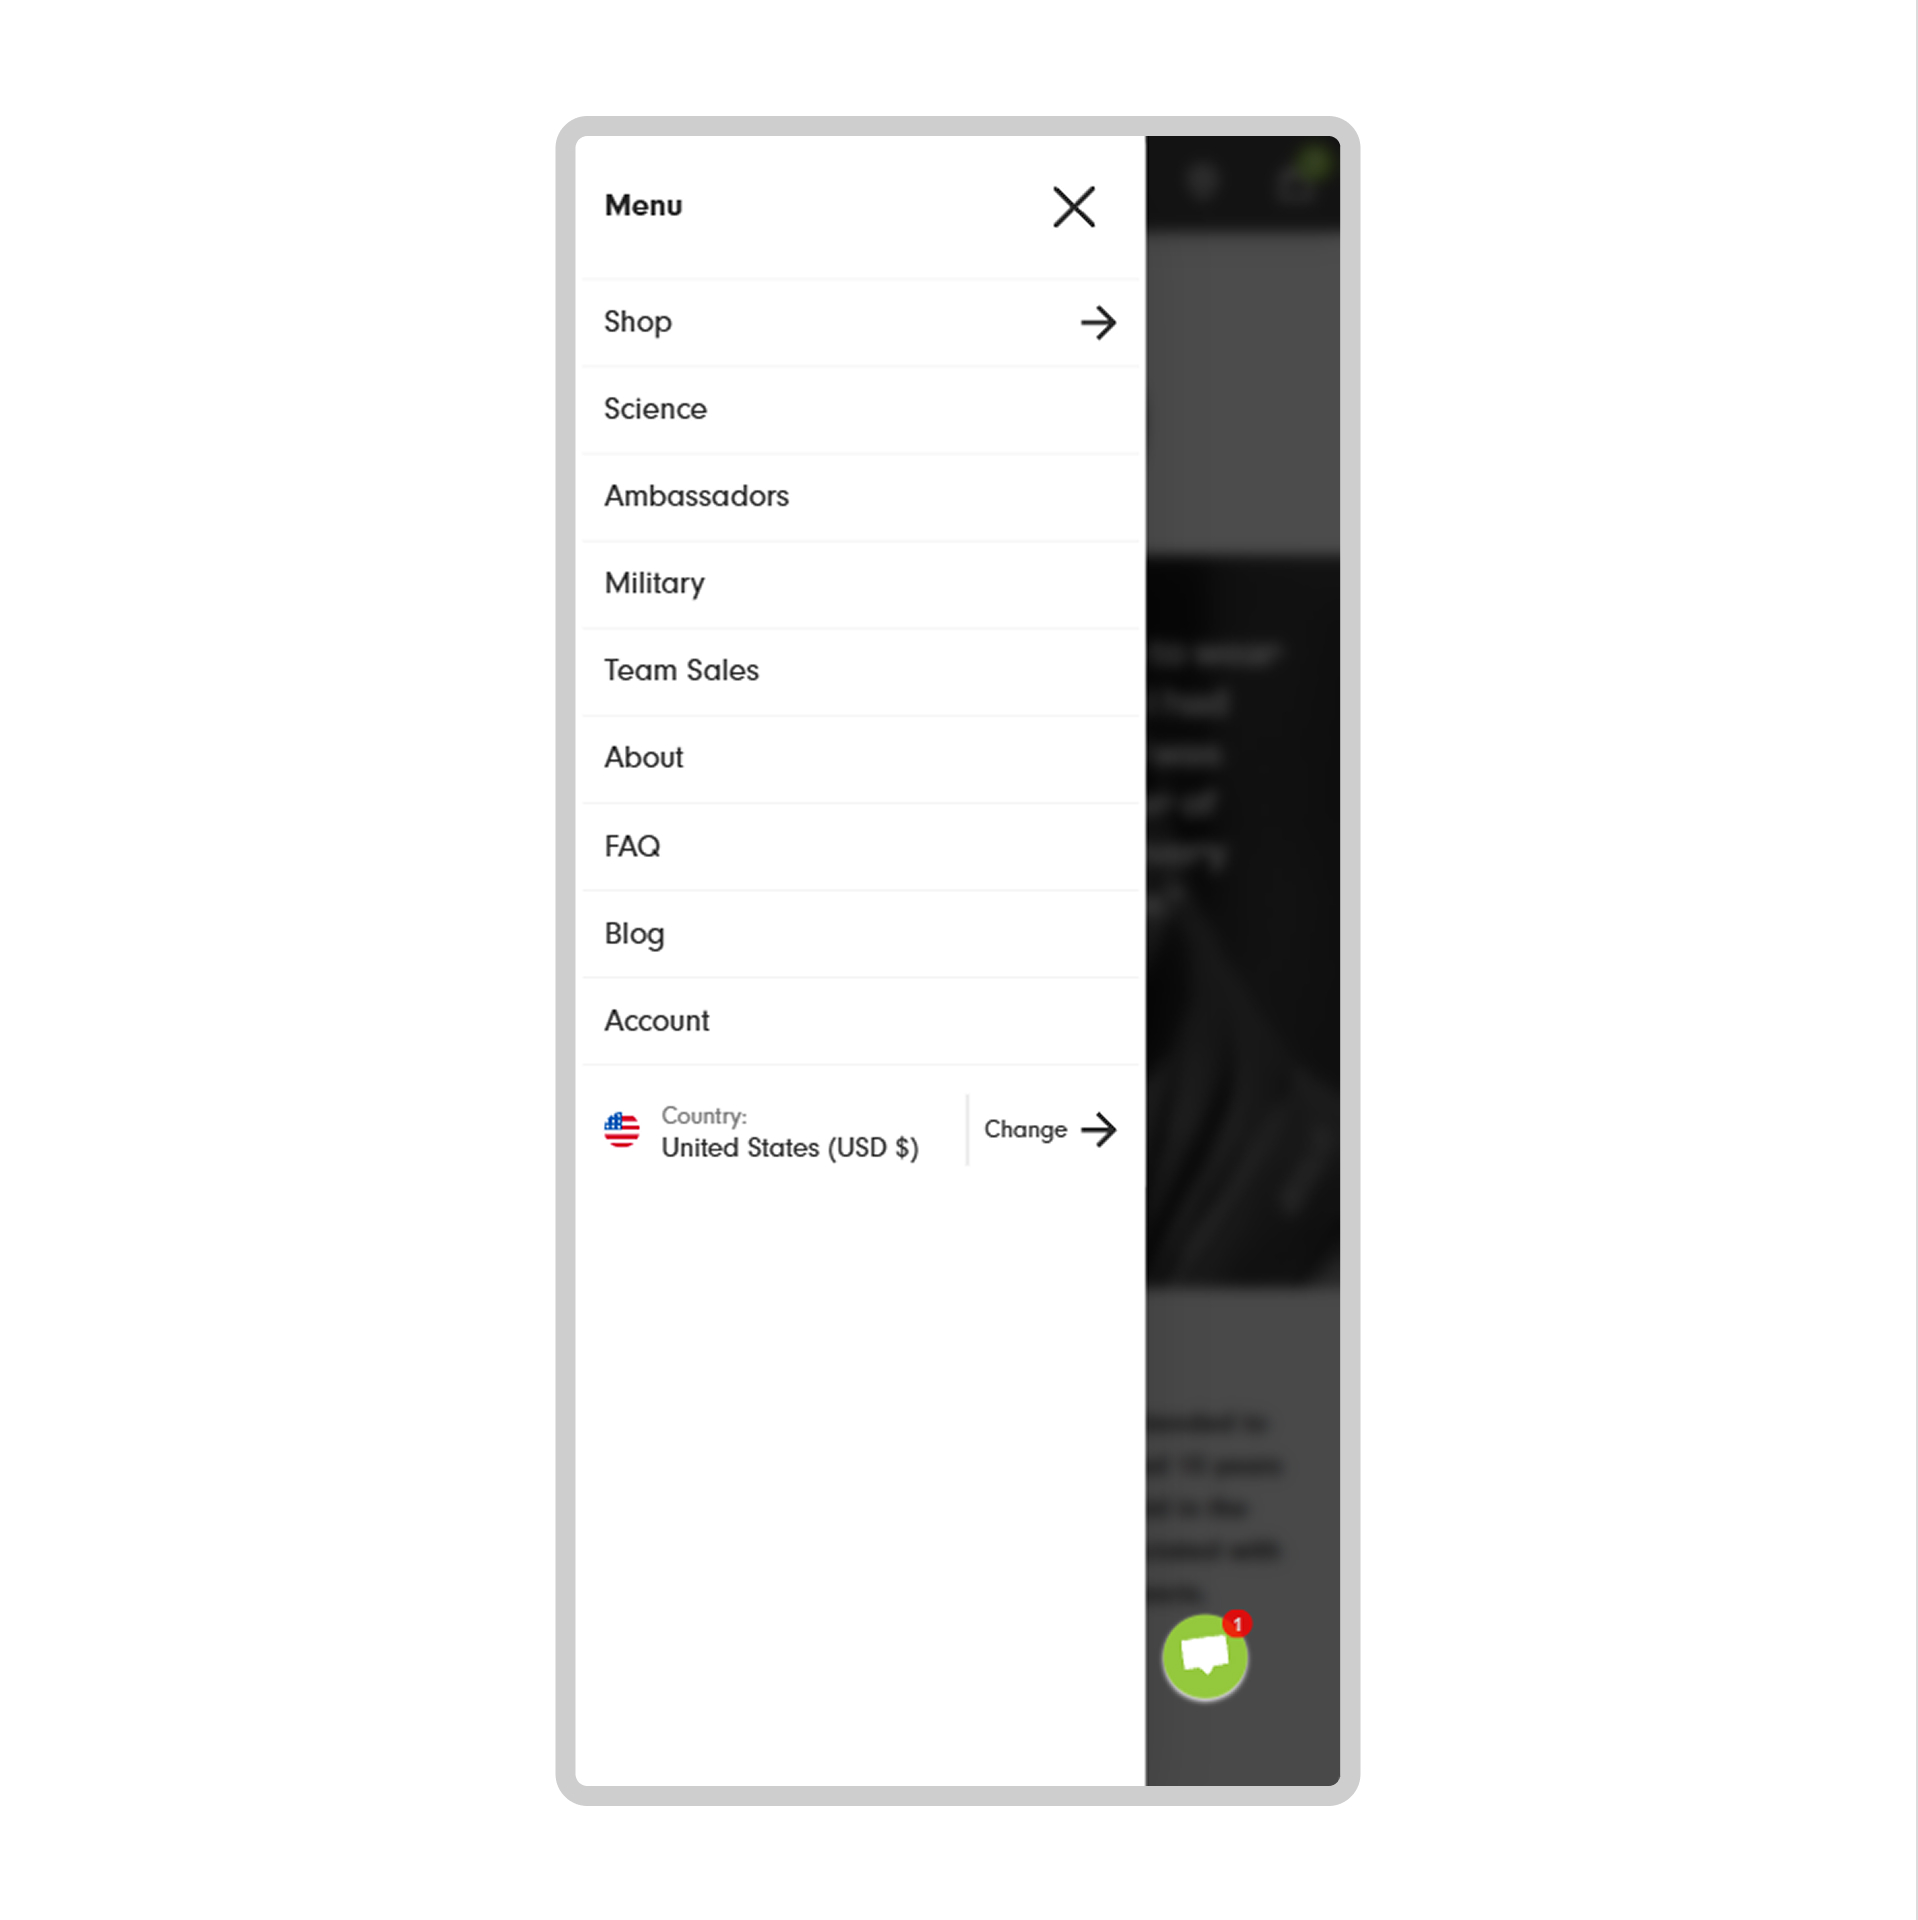
| 18 | T2 | Mobile navigation redesign | Q30 | +14% CVR, +17% RPV |
| 19 | T2 | Popup redesign & delay | BetterGuards | +4% CVR, +7% ATC |
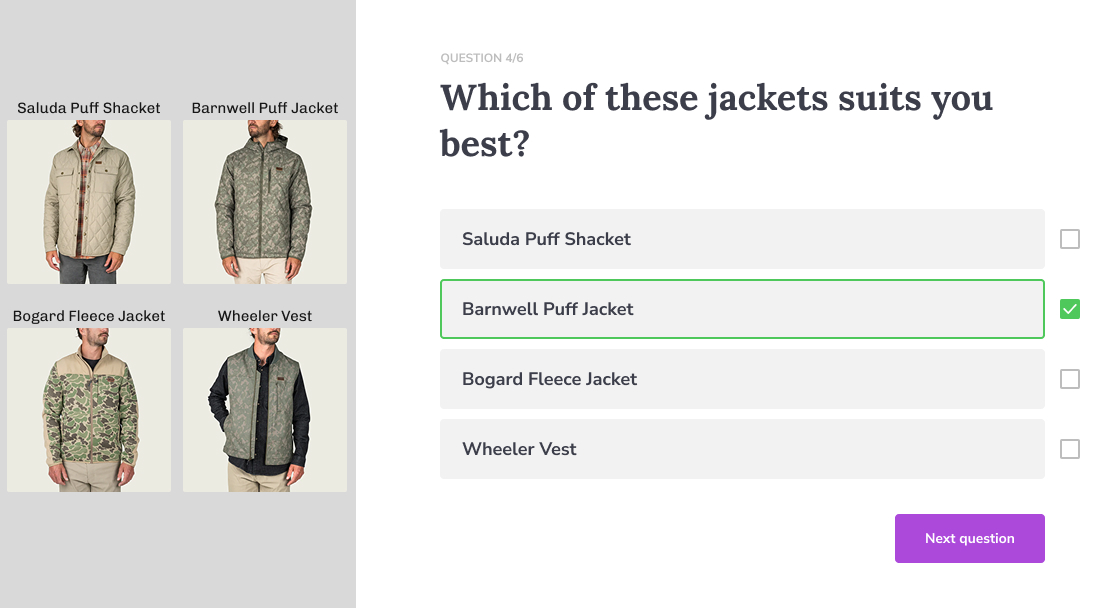
| 20 | T2 | Cart vs quiz checkout flow | Marsh Wear | +33% RPV |
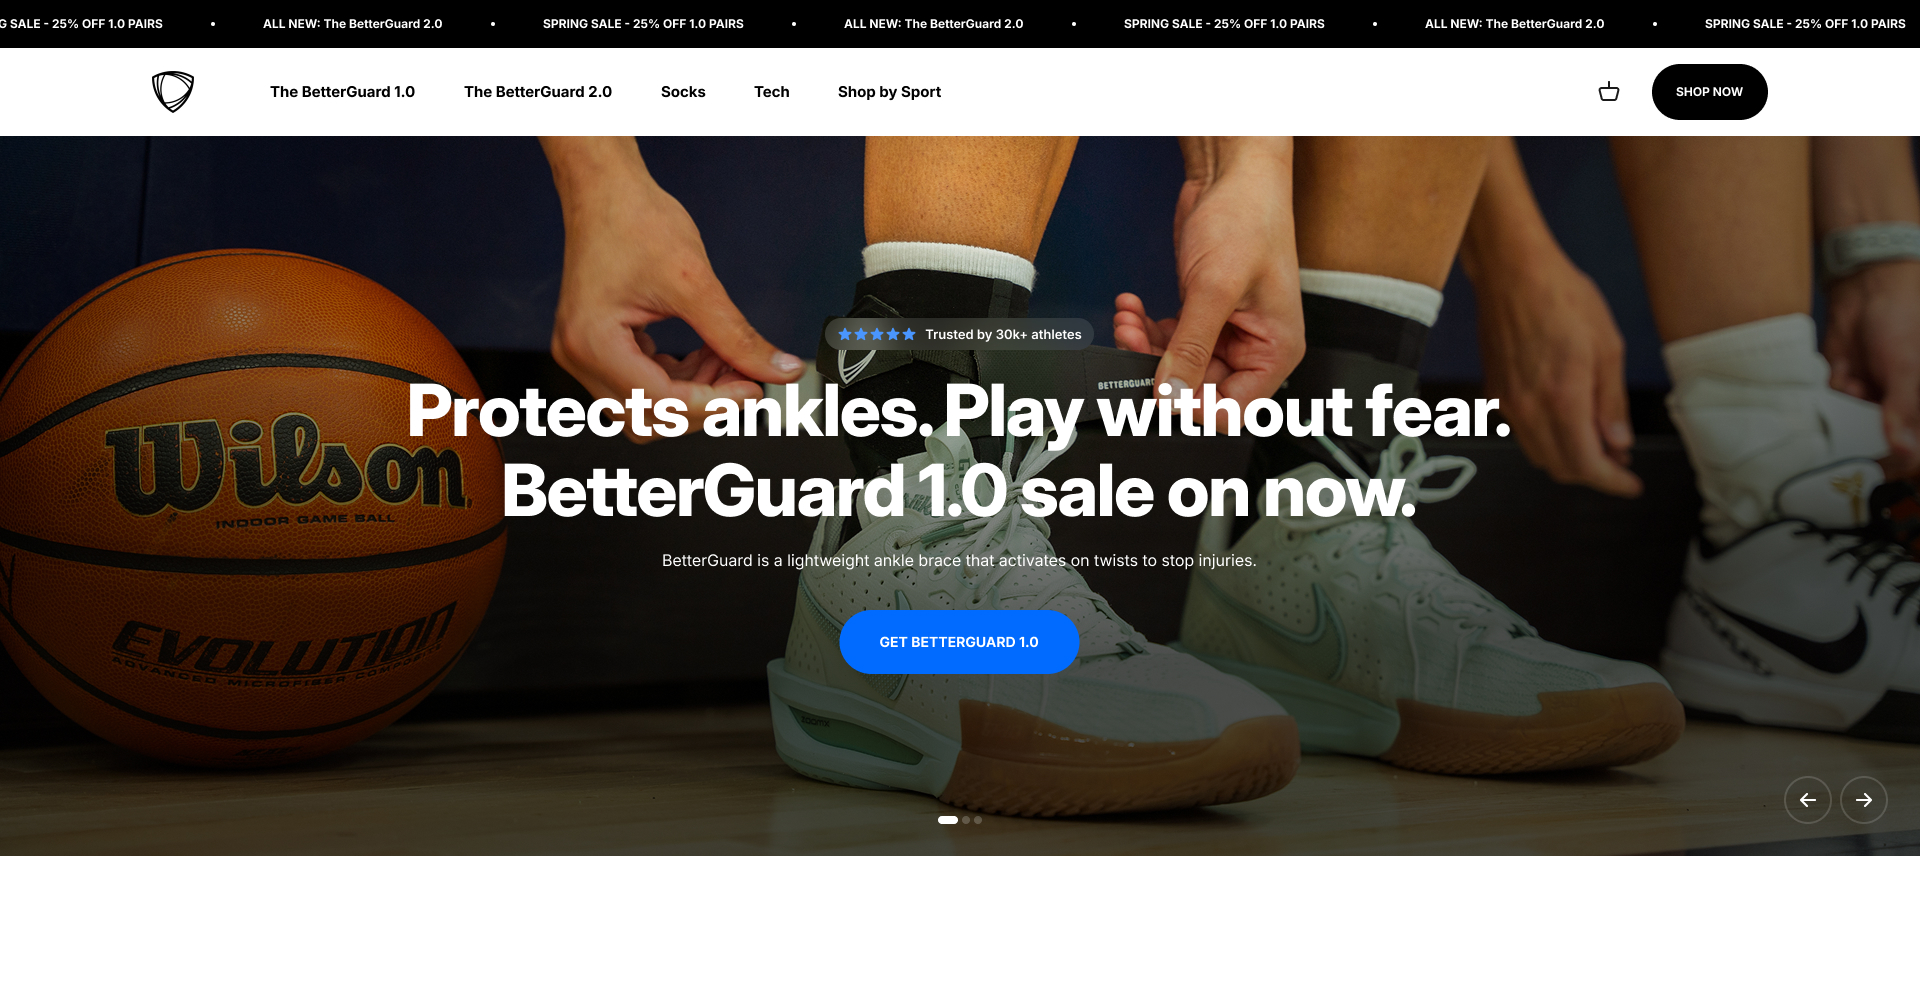
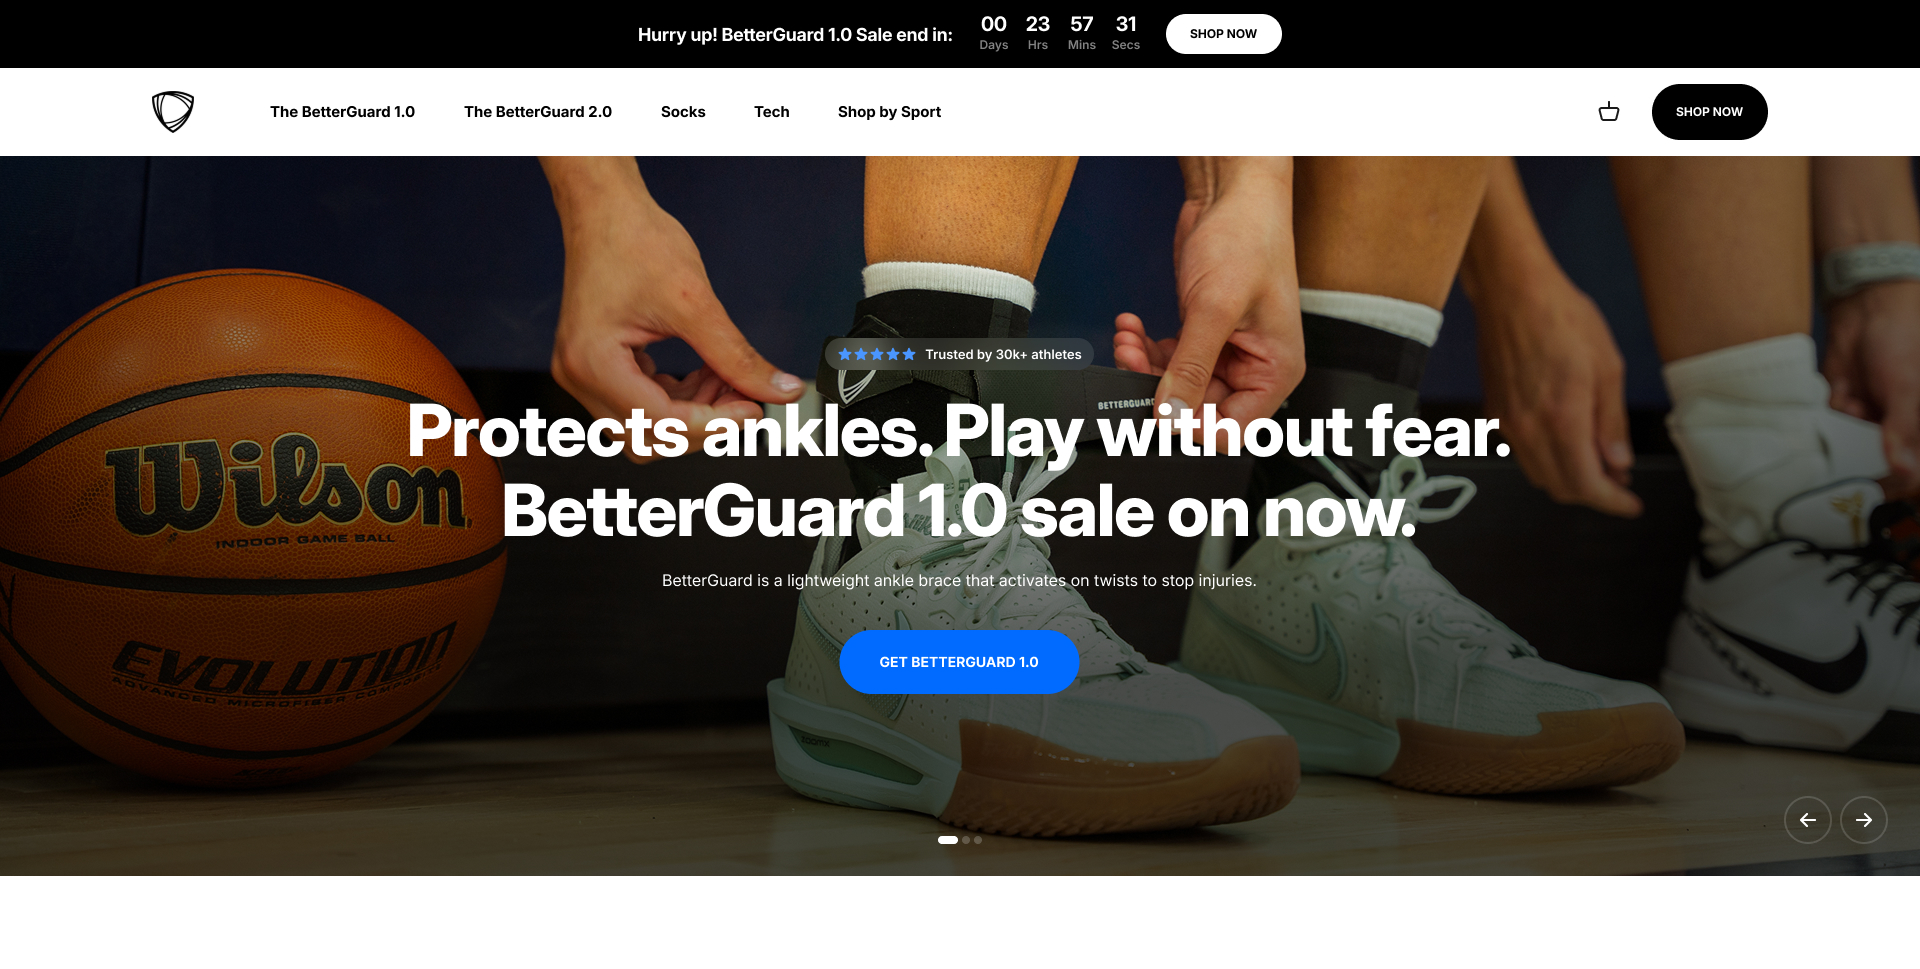
| 21 | T2 | Sale countdown timer | BetterGuards | +6% CVR, +4% RPV |
These experiments change what the customer pays, receives or how the offer is structured. They're often harder to implement and require quite a lot of testing, but they consistently produce the largest, fastest results.
Tested a 15% price increase on three flagship weighted pillow SKUs. Conversion rate went up, not down. The original price was anchoring the product as "cheap," and the target audience associated higher price with higher quality.
Tested raising the free shipping threshold from $79 to $99. Pushed customers to add one more item to qualify. Average overshoot was 25-30% above the new threshold.
Introduced a bundled kit on the PDP pairing two bestsellers at a combined discount. Despite the screenshots, the pricing is handled dynamically and increases the discount to around 15% for the bundled content. Positioned as the default recommended option.
Replaced a sitewide 15% discount code with a free branded accessory (retail value $25) on orders over $75. The gift with purchase outperformed the discount on conversion, AOV and margin.
Added a subscribe & save option on the PDP for consumable products. 10% discount on recurring orders with a toggle between one-time and subscription. Subscription set as the default selection.
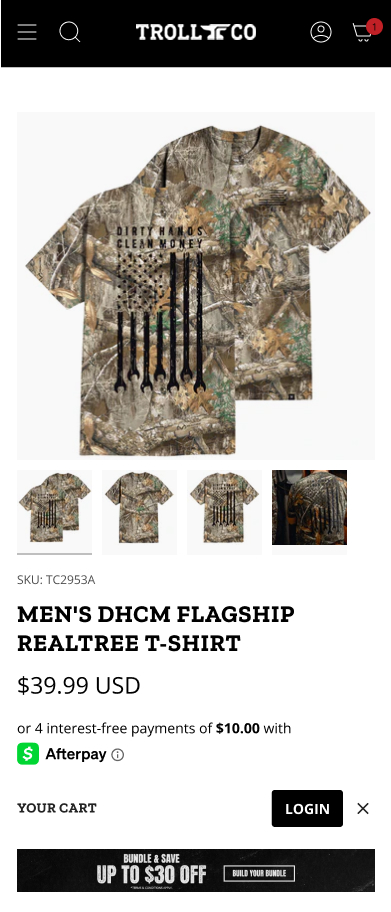
Removed the permanent discount code from the hero product and tested it at full price with stronger value messaging. Checkout completions actually increased because removing the discount code field eliminated the "let me go find a code" abandonment loop.

Replaced a flat 10% discount with tiered spend-and-save thresholds: spend $100 save 10%, spend $150 save 15%, spend $200 save 20%. Most customers aimed for the middle tier, overshooting their original cart value by 25-40%.
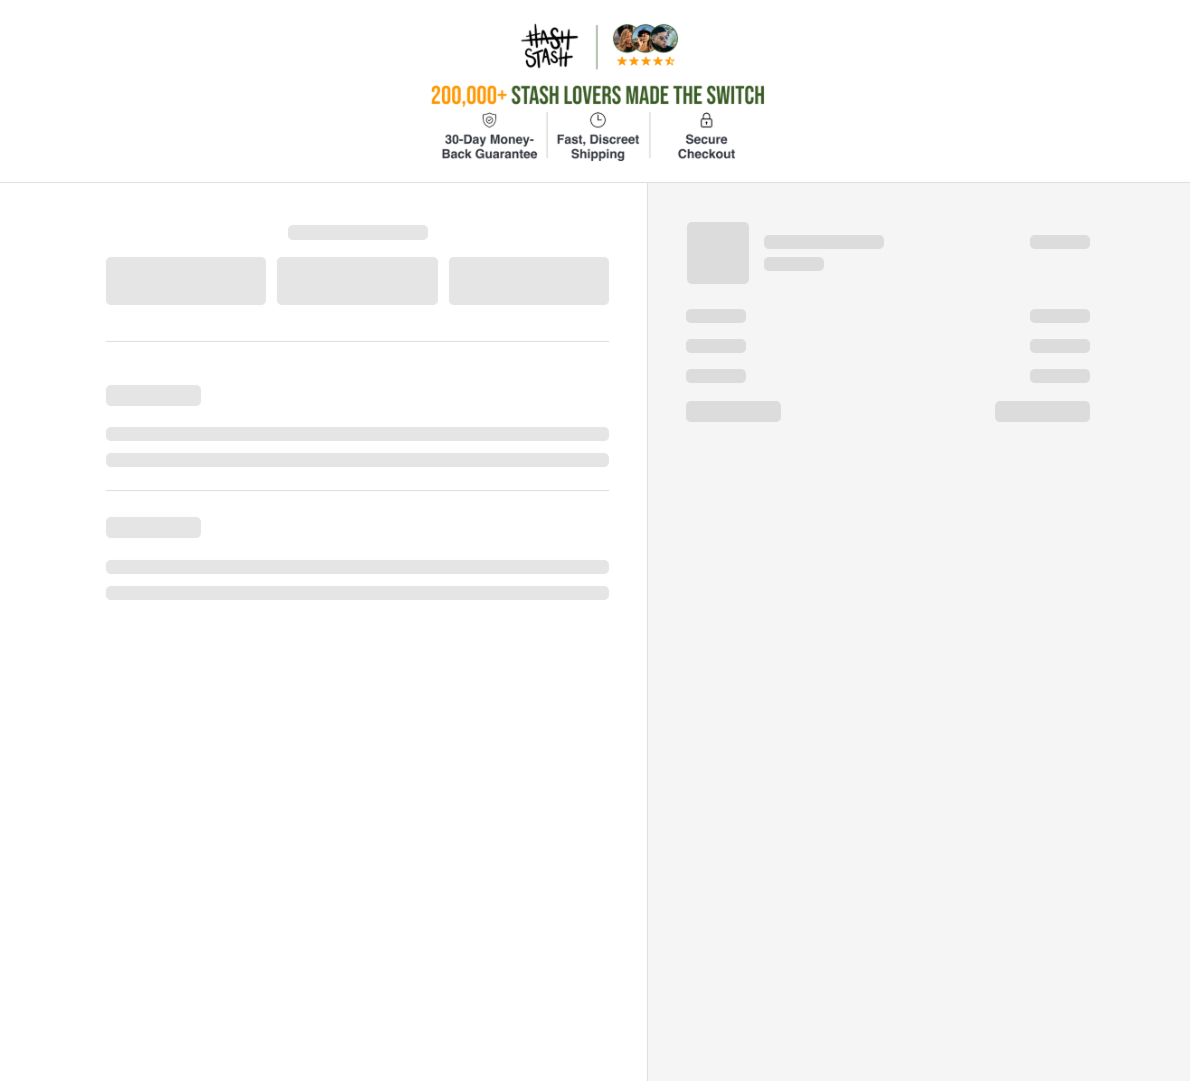
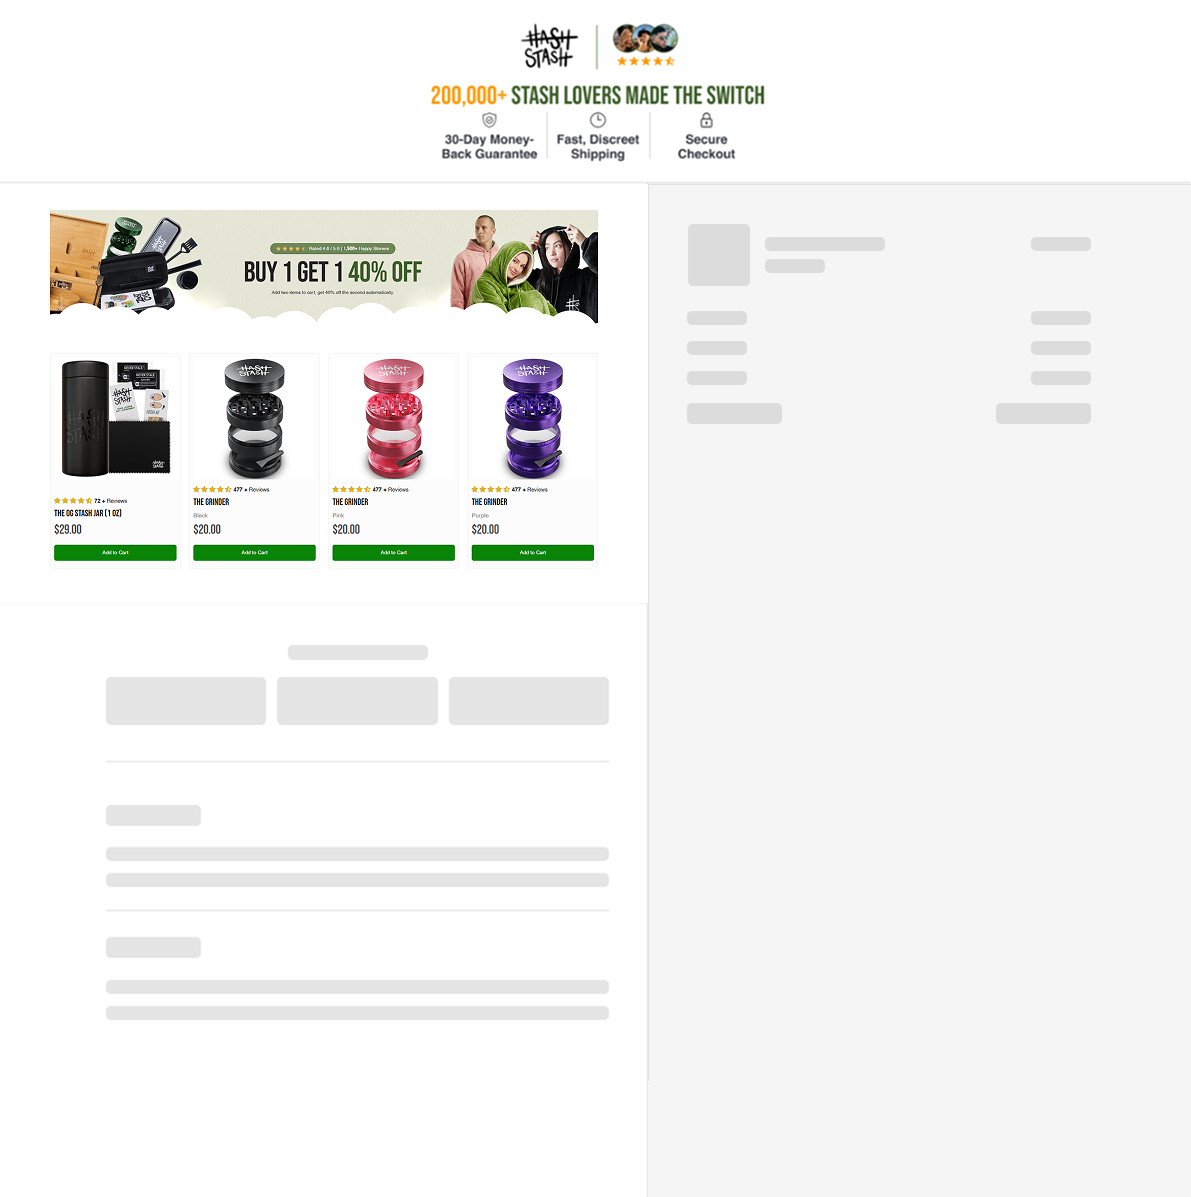
Added a one-click upsell page between checkout completion and the thank-you page. Offered complementary products with a "Buy 1 Get 1 40% Off" incentive, purchasable with a single tap. No re-entering payment details. 14% of customers took the offer.
Created a $49 "First Timer Kit" with curated entry-level products bundled at a slight discount. Targeted at new visitors from paid ads. Reduced decision paralysis for first-time buyers who didn't know where to start.
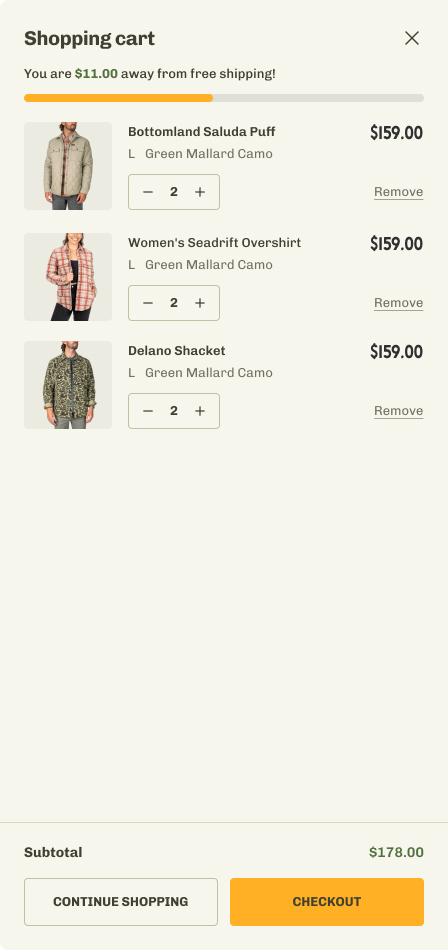
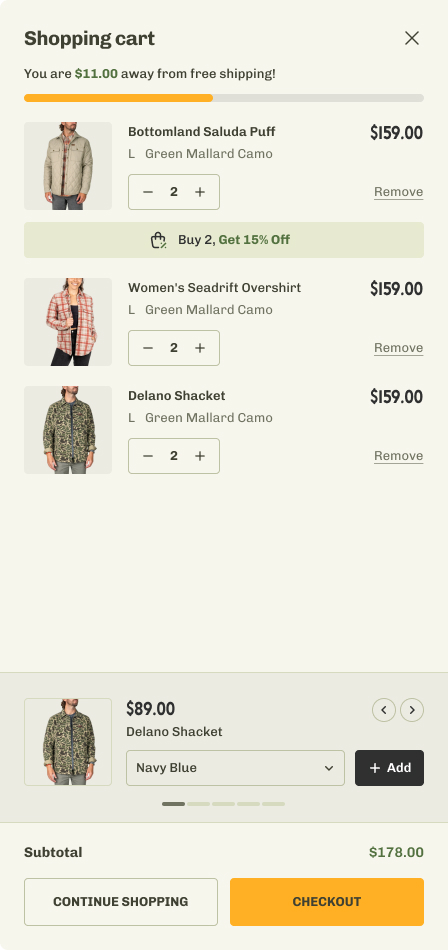
Added a "Buy 2, Get 15% Off" incentive badge directly on the product card in the cart, paired with a cross-sell carousel at the bottom. Encouraged customers to add a second item from the same category.
Tier 2 experiments change the structure of the buying experience. How customers discover products, navigate the catalogue and move through the funnel. They make the existing value proposition easier to find and act on.
Made the desktop navigation bar sticky so it stays visible while scrolling.
Added a "Your Story, Our Hats" user-generated content section. Real customers wearing the product.
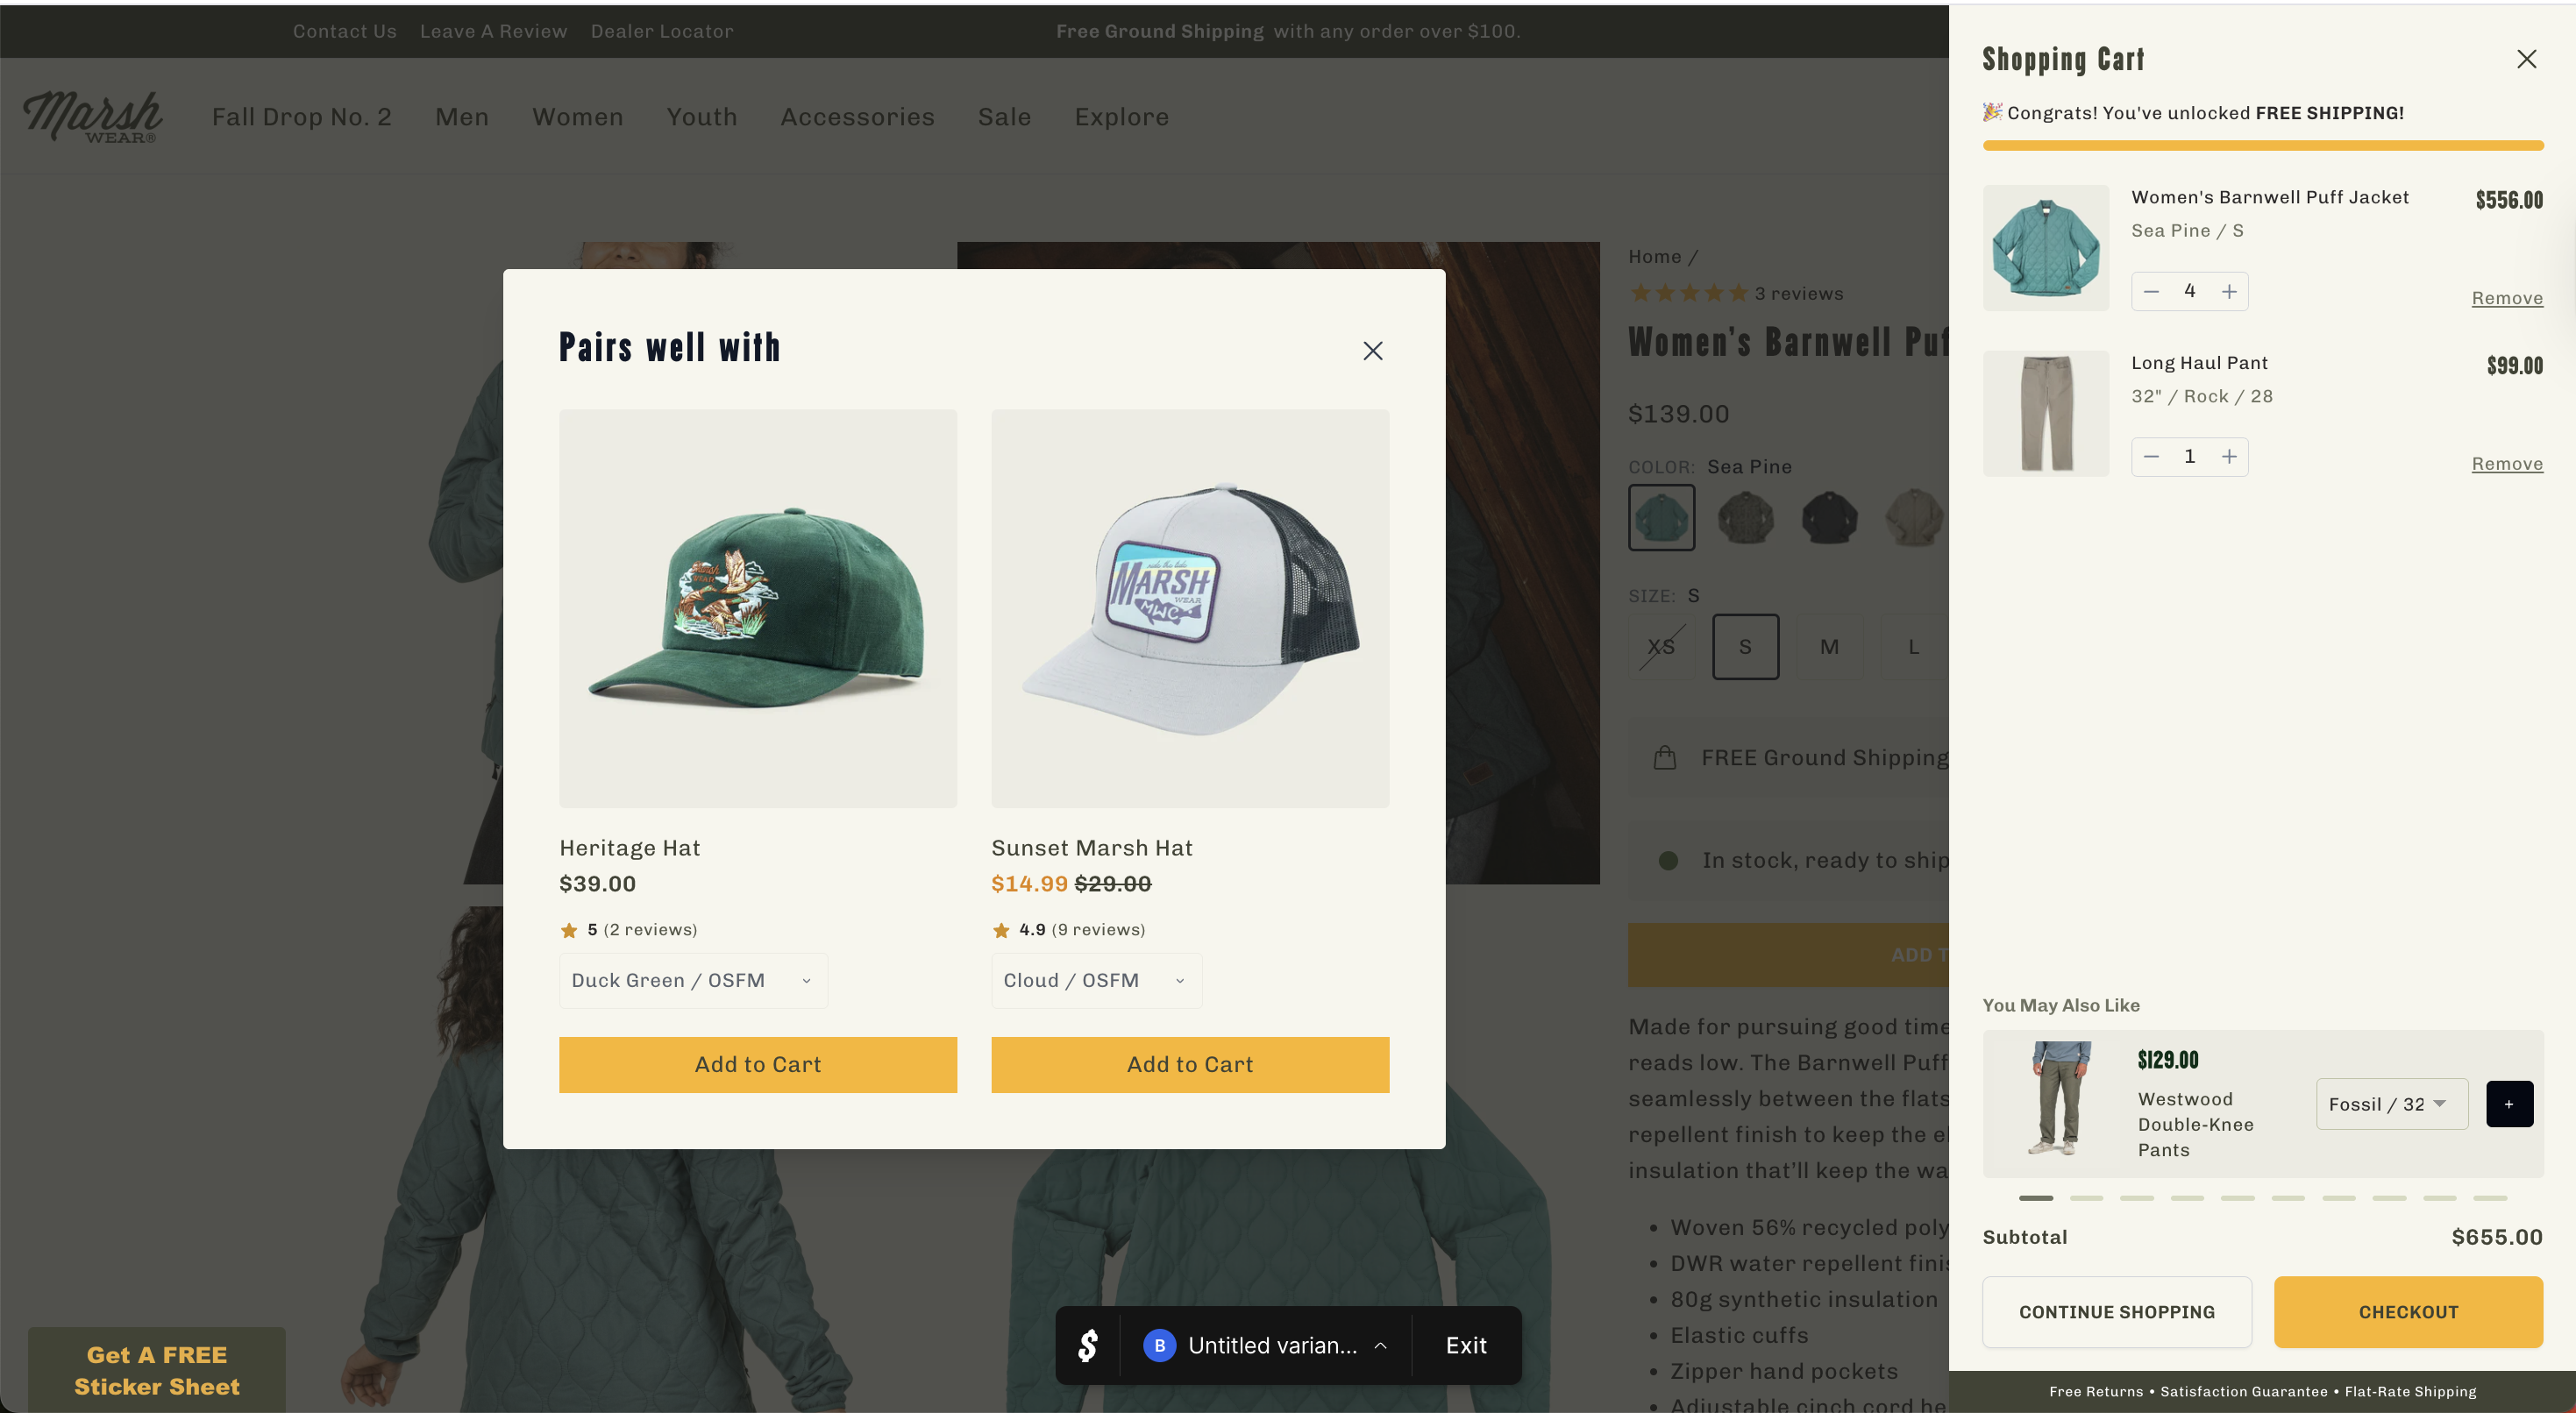
Added a "Pairs well with" pop-up showing complementary products when a customer adds to cart.
Added a "Get free socks!" callout with product image directly above the Add to Cart button.
Replaced a product-heavy homepage with a lifestyle hero and "Shop by Category" grid.
Added feature callouts and benefit bullet points to collection page product cards.
Switched mobile collection from two-column grid to single-column with full-width lifestyle photos.
Redesigned mobile navigation to highlight three main products at the top with images and descriptions.
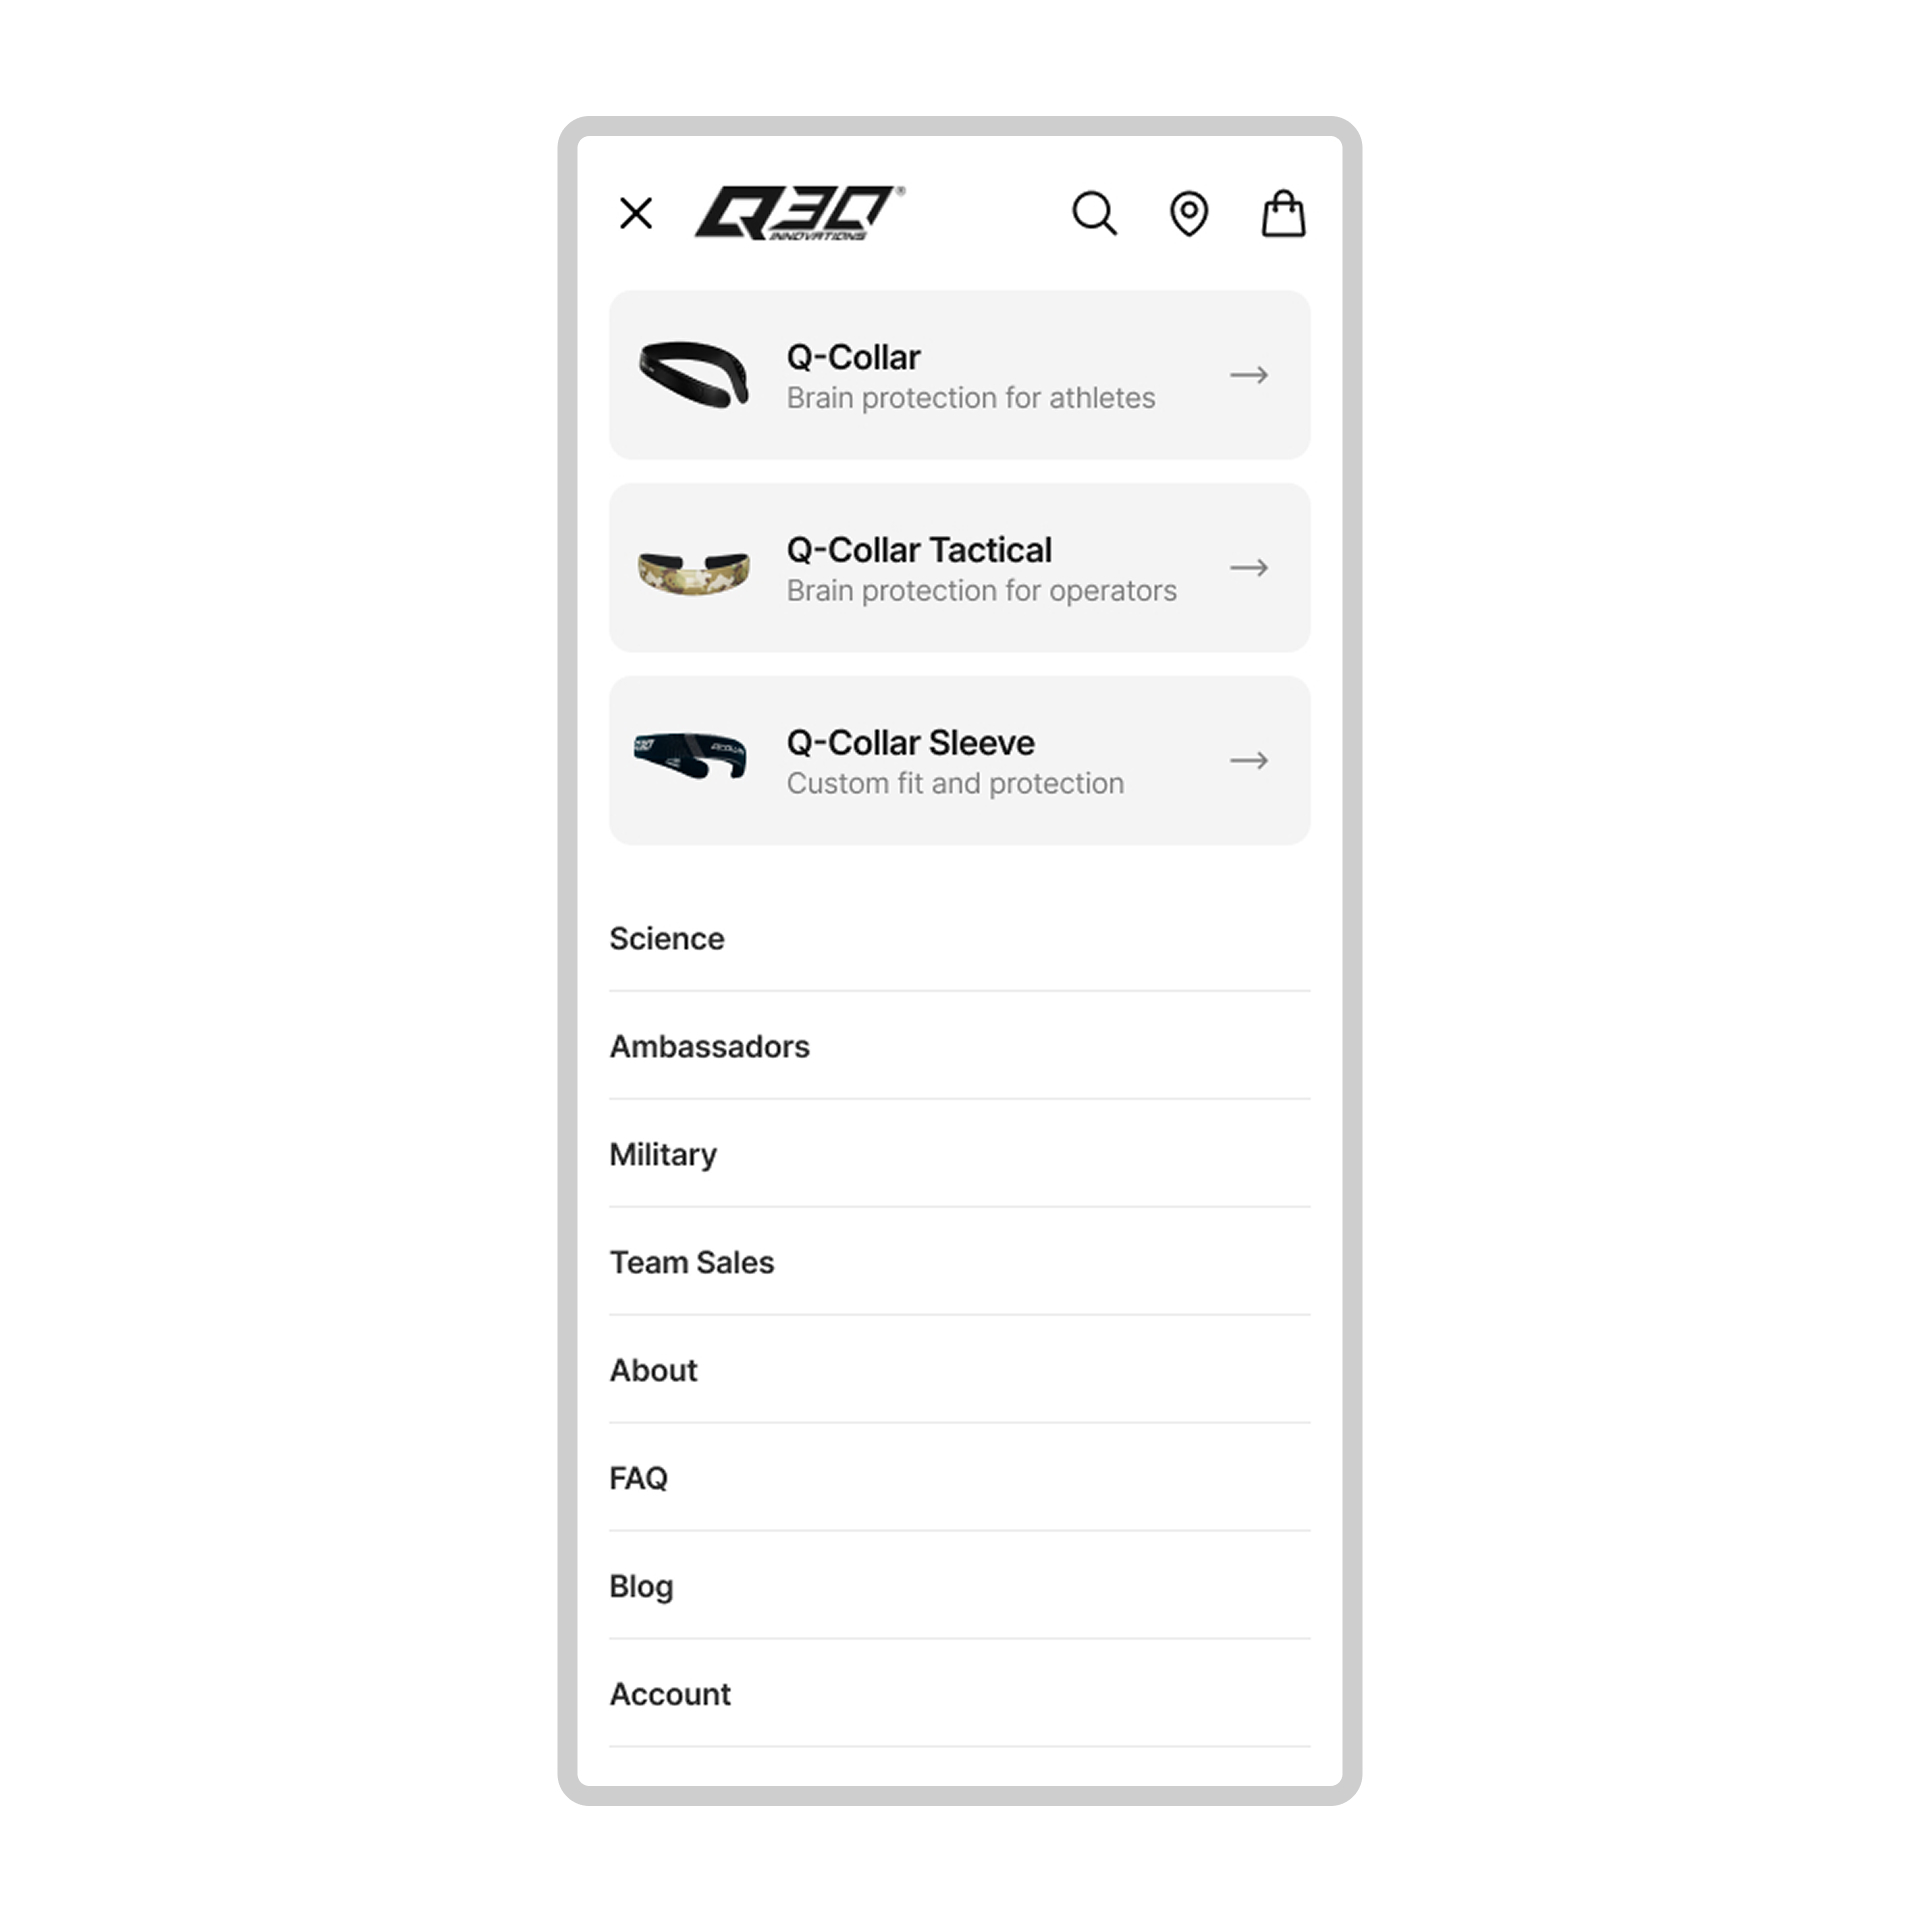
Redesigned the promotional popup from a generic split-screen layout to a mobile-optimized, product-focused design. Combined with a 60-second delay.

Replaced the standard browse-and-add-to-cart flow with a guided quiz that recommends products based on customer answers.
Added a sticky countdown timer bar to the top of the site during a clearance sale. Urgency tied to a real event, not a fake evergreen countdown.
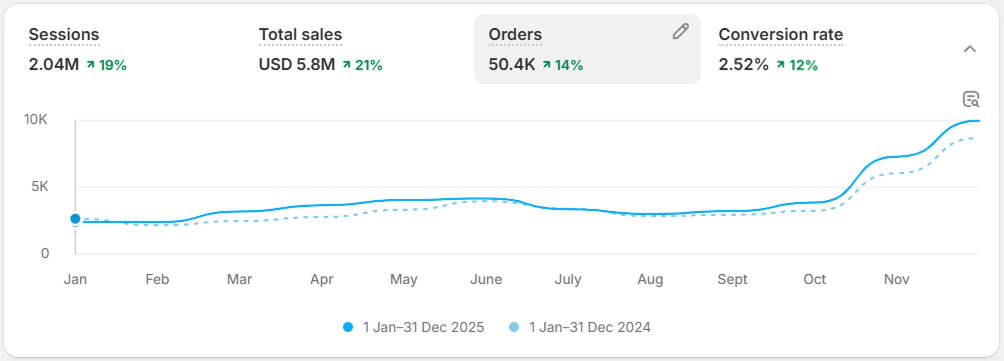
| Metric | 2024 | 2025 | Change |
|---|---|---|---|
| Net Revenue | $2.58M | $3.09M | +$504K (+20%) |
| Conversion Rate | 0.92% | 1.53% | +67% |
| Add to Cart | 20,399 | 29,573 | +45% |
| Sessions | 1,223,544 | 899,092 | -27% |
| Returns | 2,365 | 1,808 | -24% |
Revenue grew while traffic dropped 27%. Better traffic quality plus a better on-site experience did the heavy lifting.
Q30 makes the Q-Collar. A $199 FDA-cleared neck device that reduces brain movement during head impacts. Selling a science-backed $199 product to anxious parents who've never heard of the category.

"Tim and the Clean Commit team have been my secret weapon. I didn't have time to keep looking for ways to improve our store, and they've found optimizations I wouldn't have thought of. They're super responsive and require very little oversight."
Charlie Kunze, Director of Marketing, Q30 Innovations
| Metric | Before | After | Change |
|---|---|---|---|
| Conversion rate | 1.83% | 2.38% | +30.3% |
| Average order value | $99 | $114 | +14.8% |
| Monthly revenue | $308K | $741K | +140.7% |
Conservative annualised revenue impact: $590,458 (projected at 0.75% of measured test outcomes, 18 implemented winners, 37 tests over 12 months).
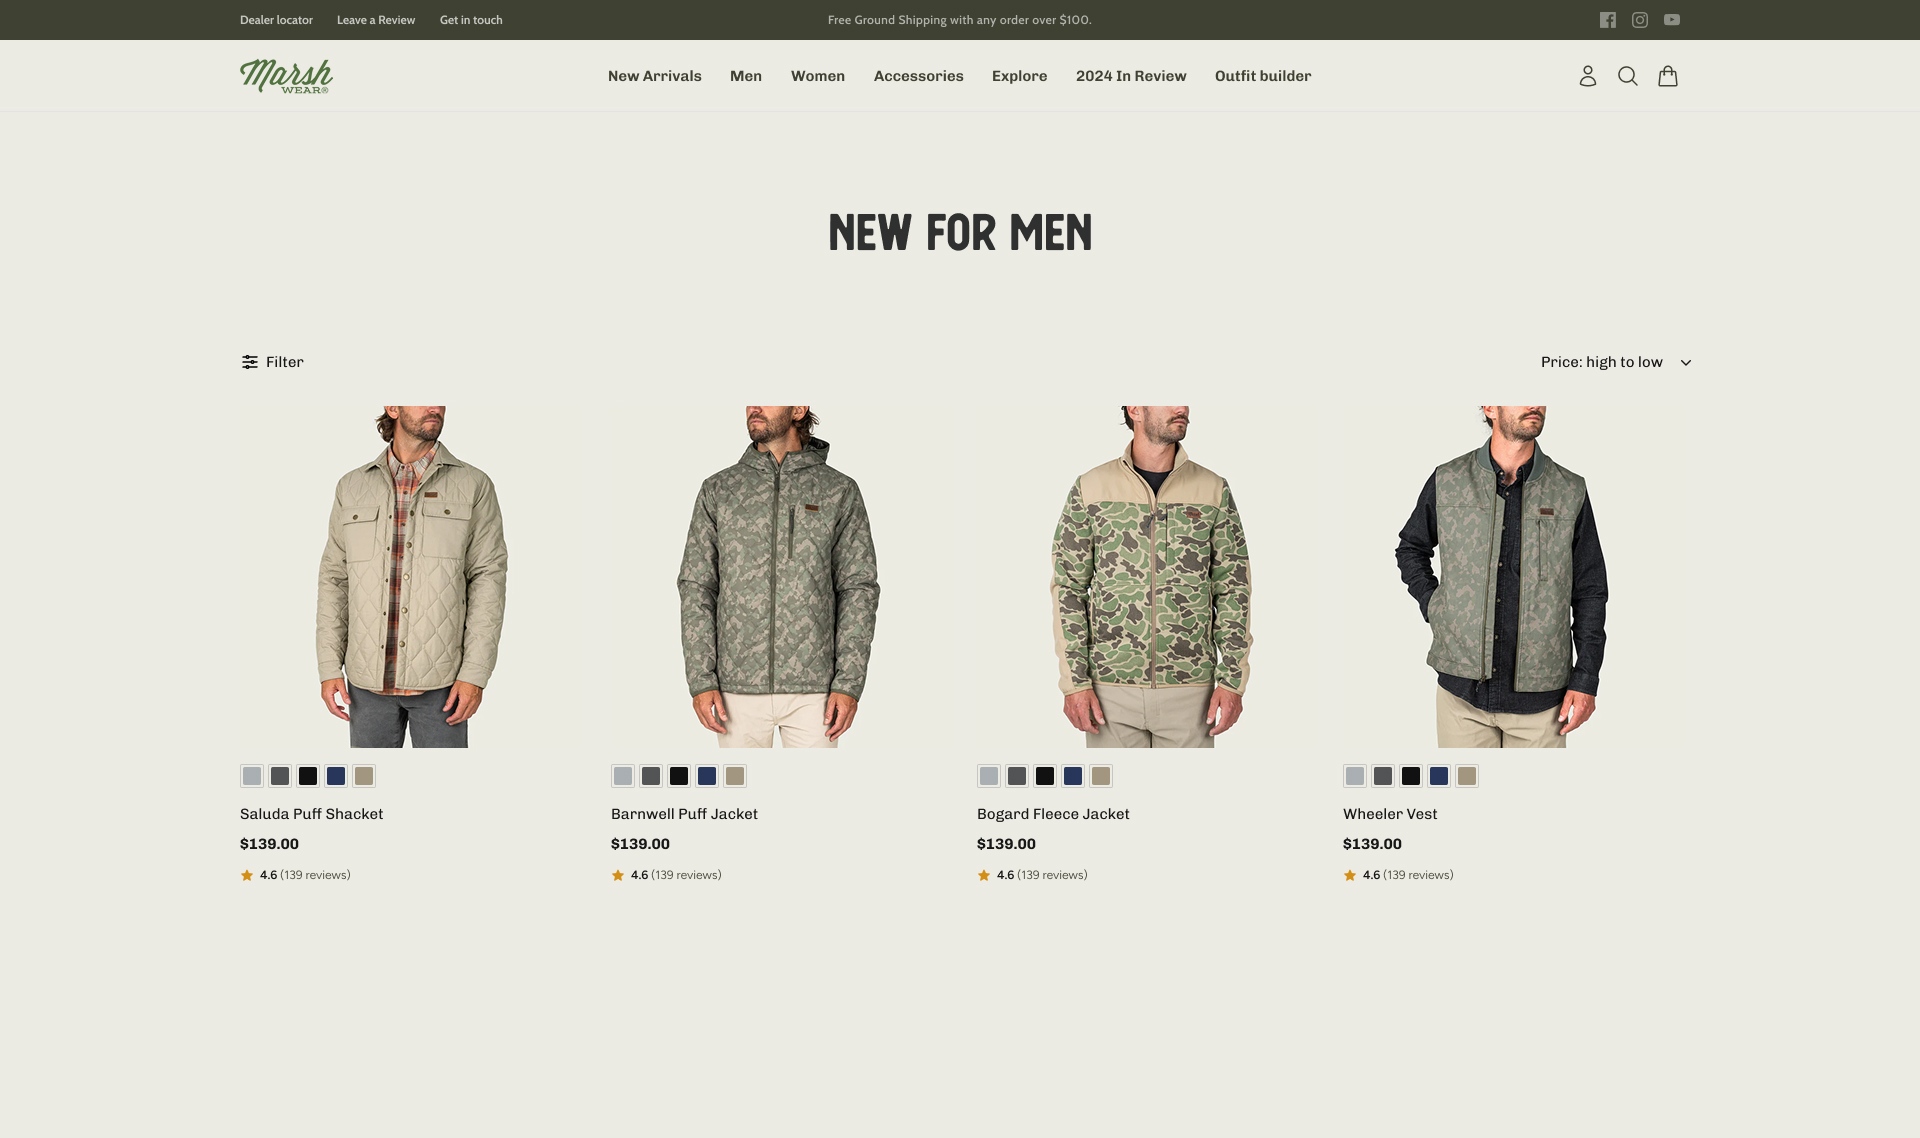
Premium outdoor apparel. Fishing, hunting, camping, boating lifestyle clothing. Around $5M/year on Shopify, 75%+ mobile traffic, conversion rate stuck below 2%. Owned by AFTCO, a brand we'd already been running a full CRO program on.
The marketing team was constantly updating the site, but every change was a guess. Layers of technical debt, no measurement, 75% of traffic on a mobile experience built as a desktop afterthought.
After 40 hours of diagnosis, the biggest wins came from making products look better and feel more desirable, not from reducing friction. That surprised us. Marsh Wear's customers are driven by brand belonging and product desire. They want UGC, real photography, the feeling of "I want to wear that." Urgency tactics cheapened the brand and hurt performance.
| Test | RPV Lift | Annual CII |
|---|---|---|
| Enhanced Search Results | +14.7% | $296K |
| Mini Cart Redesign | +9.9% | $36K |
| Discount Price Styling | +10.0% | $32K |
| Product Card Redesign | +9.3% | $30K |
| Mobile Menu Redesign | +10.7% | $22K |
| Hand-Picked Cross-Sells | +15.0% AOV +7% | $13K |
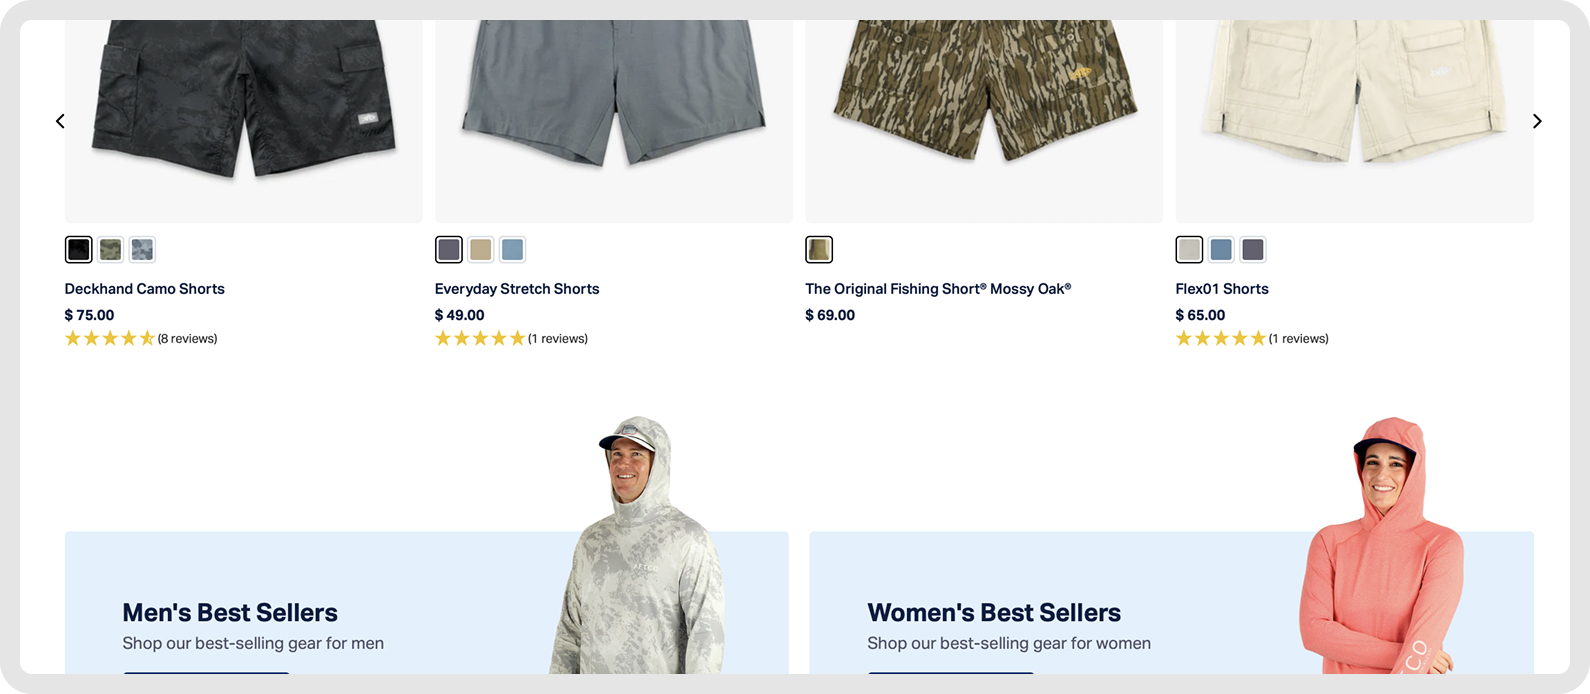
Most cross-sell implementations use algorithmic "frequently bought together" recommendations. We manually selected every product pairing. Fishing shirt with a specific hat. Jacket with matching gloves. Cheap, complementary, curated by humans who understood the products.
Result: +15% RPV, +7% AOV. Highest per-visitor revenue lift in the program. Human curation plus good timing beat the algorithm.

"Kamila, Tim and WK from the Clean Commit team are awesome. They run a tight ship and their program has been one of the main factors behind our growth this year."
Casey Sandoval, eCommerce Director, Marsh Wear
| Metric | Before | After | Change |
|---|---|---|---|
| Conversion rate | 2.28% | 2.69% | +18.2% |
| Average order value | $113 | $146 | +28.6% |
| Monthly revenue | $212K | $287K | +35.5% |
Conservative annualised revenue impact: $915,128 (projected at 0.75% of measured test outcomes, 11 implemented winners, 35 tests over 12 months). Year-over-year gross revenue: $2.05M to $3.87M. +88.6%.
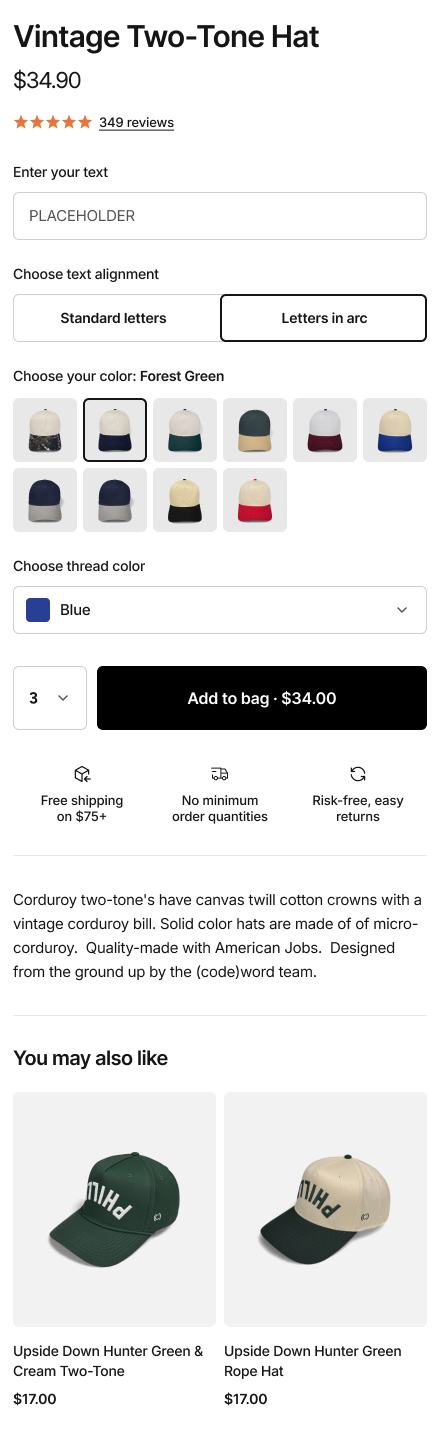
Custom hat company. Order a single embroidered hat with no bulk minimum. Customers type in text, choose a style, pick placement. Around 85 to 90% of hats get customized, so the customizer is the product experience.
Conversion stuck at around 2% with no clear path forward. The off-the-shelf customizer plugin couldn't be A/B tested, had limited styling options, looked visually cheap and was completely locked down. For a store where 85%+ of customers have to use it to buy anything, that wasn't a minor UX issue. It was a revenue ceiling.
| Test | RPV Lift | CVR Lift | Annual CII |
|---|---|---|---|
| Customizer Rebuild | +32.6% | +6.8% | $375K |
| Condensed Product Gallery | +62.9% | +23.9% | $164K |
| Review-Based FAQs | +33.2% | +8.4% | $81K |
| Input-First Mobile Customizer | +12.0% | +2.8% | $57K |
| Enhanced Mobile Customizer | +21.7% | +3.0% | $54K |
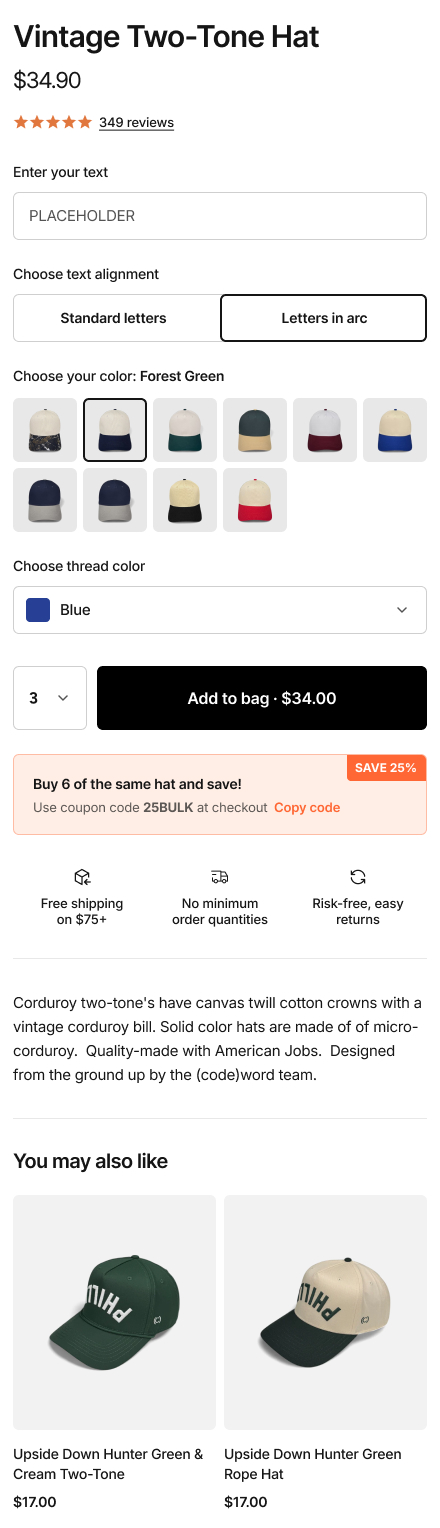
The customizer preview was blank by default. Customers stared at an empty hat mockup, trying to imagine what their text would look like.
We added one thing. Placeholder text in the preview. "YOUR TEXT HERE" shown on the hat by default.
Result: +15.1% CVR, +9.4% RPV. One line of placeholder copy, 15% conversion lift.
The biggest win wasn't a traditional A/B test. It was rebuilding the customizer plugin from scratch and then testing the new one against the old one.
New customizer: better styling, cleaner UI, mobile-first, real-time preview with zero lag, every element testable going forward. It also integrated with Nate's embroidery machines, automating a workflow that was previously manual.
+32.6% RPV, +6.8% CVR, +24.3% AOV. $375K annual impact from a single experiment.

"Our conversion rate is already up 10-15% just in a month or two of working with them. If you're on the fence, just do it. You will not regret it. They're a great team, they really work to understand you and your particular business."
Nate Montgomery, Founder, Codeword (video testimonial)

"CR has gone up roughly 800% since we started working on the store… which is pretty neat."
Rachael Nelson, eCommerce Manager, Peluva

"Conversion rate went up almost 300%."
Sarah Smyth, Australian Black Worms

"Fantastic, communicative, and made constant progress."
Tim Ruswick, GameDev.tv
We run a fairly standard CRO process that involves diagnosing potential problems with analytics, looking at heat maps, watching session recordings, surveying your customers and doing all of the stuff that conversion rate optimization agencies typically do.
Here's what we do differently:
You can't trust A/B testing platforms to be accurate, which should carry some weight coming from a CRO agency. We never take the statistics at face value. What we do is run multiple AA tests. If you're not familiar with an AA test, it's one where you keep the control and the variant exactly the same and let it run for up to three weeks, then measure the impact. Often you'll see a 2 to 4% change between control and variant, which tells you that 2 to 4% is your minimum measurable effect. So if you ever run a test and it's not greater than that, you have to ignore it because that's just variance, the noise that comes from running A/B testing tools and not having billions of page views like some of the enterprise platforms.
We're not just looking for friction in how customers interact with your website. We're looking to understand what drives them, what they're afraid of, why they're here, what they're complaining about. These behaviors, which we have a 12-point scale for, underpin every decision they make. We need to ask whether the changes we're making on the website are going to help customers move closer to the behaviors that are driving them.
CRO agencies have a reputation for just changing button colors. We don't do that because we've all come from e-commerce backgrounds in owning or running e-commerce stores. We understand that you need to change stuff to have real impacts, and changing things means prices and product offers and bundles and the things we've mentioned throughout this document. We're going to do the hard stuff to change those metrics and come up with creative new combinations that bring about profitability.
Our goal is to run as many meaningful experiments as possible. There are some limitations on how we can do this with Shopify but we work around those limitations. Our goal is to run at least two experiments per week, with a total goal for the year of 100 experiments. We have around a 30% winning rate which means you'll see thirty different changes to your website meaningfully move your profitability over the course of the year. That's how we can back up the claims we make in our case studies and the experiments you saw earlier in this document. We're not sitting on our hands. We're looking for rapid ways to help your profitability and explore new avenues to make money.
You've seen the case studies, the process and the experiments we run. The next step is a call to go through it together.
We'll walk through your current metrics, discuss how we'd approach your store and confirm the opportunity size.
Tim Davidson
tim@cleancommit.io
Total elapsed time from signed agreement to live tests: 14 days.
We currently have room for two new engagements this quarter. If we're at capacity when you reach out, we'll tell you and offer a start date rather than overcommit.
Clean Commit has been around since 2018 and is considered one of Australia's leading conversion rate optimization agencies. Our team is spread globally across Europe, America and Australia. We help Shopify brands turning over between $2M and $50M in revenue who have hit a growth ceiling.
We're a small team made up of experts in their fields. Senior project managers who have worked on large enterprise software platforms and infrastructure rollouts. Senior developers with a decade of experience designing web systems, UI and UX. Analysts with tertiary backgrounds in psychology, analytics and statistical analysis. Because we're all experts in our respective fields, we look at websites through a different lens than other teams.
We do one thing: scientific testing, customer analysis and conversion rate optimization for Shopify. It's our specialty and we know it inside and out.
| Brands optimized | 106+ brands |
| A/B tests run | 1,000+ with real traffic and statistical rigor |
| Revenue generated (last 12 months) | $1.5M in measured, attributable lift |
A small, senior team. You work directly with us, not a layer of account managers.

Tim Davidson
Founder & Lead Strategist

Wojciech Kaluzny (WK)
Co-Founder & Lead Engineer

Kamila Kucharska
Project Manager

Patryk Michalski
Senior Web & UX Designer

Cormac Quaid
Shopify Engineer

Borisa Krstic
Shopify & React Engineer
We use a naming and intent convention that categorizes each part of the UI and cross-references it with the motivations of the customer. Someone looking for information on a PDP is on a different journey to someone flirting with purchasing on the same page, so we treat those as separate spaces.
When we scope an experiment, we stick to one defined part of the site with one defined intent. We can go surprisingly granular, and at that level of resolution it takes at least 18 months to exhaust all the combinations on a single store. So cannibalization is something we sidestep structurally, not something we manage case by case.
Every test is a controlled A/B. A percentage of your traffic sees the original (control), the rest sees the variation.
We measure a range of metrics. Conversion rate, revenue per visitor, average order value, bounce rate and a handful of supporting signals, all pulled directly from the testing platform.
We also run an AA test on each store before we start. That tells us the natural variance of your pages. If we know your baseline conversion rate naturally swings by around 5%, we won't call a 5% lift a win. That gets declared flat. It's the only way to separate real movement from statistical noise.
We push for above 90% statistical confidence before calling a winner. For stores with large traffic we'll reach into the 95%+ range. For smaller stores 90% is our working floor.
We default to Intelligems on most engagements.
Intelligems uses randomized participation, which means a single visitor can be part of three, four, five or more concurrent experiments without the results interfering. That matters because it lets us maintain a high testing velocity without the tests tripping over each other.
We've also used Shoplift extensively.
We come to you and tell you.
We're incentivized by the wins, not the retainer, so a quiet stretch hurts us too. If we go a few months without a real win we'll suggest whatever we can to course-correct. If it still isn't landing, we'll raise the idea of mutually ending the engagement. We're not precious about the contract. We want the big wins, and when the shared incentive isn't there we'll say so.
We aim for up to 8 concurrent experiments if traffic permits and it makes sense to run that many, but often it's closer to 4 or 5. Our average win rate sits between 20 and 30%, which means 20 to 30 winners a year compounding into your baseline.
Yes. You don't need to coordinate with us.
We run GitHub Actions behind the scenes that pick up your changes and apply them to the live experiment so everything stays in sync. We aim to be relatively invisible in the background. You run your marketing, merchandising and content updates as normal.
Tim is based in Australia (AEDT). The rest of the team is distributed across Europe: WK, Kamila, Patryk, Borisa and Cormac.
Tim is the account lead and the escalation point for anything strategic or contractual. Kamila is who you'll talk to in Slack day to day. She sends running updates and manages delivery. The bi-monthly sync call where we walk through new experiments and results is typically with Kamila and WK (our co-founder and lead engineer).
Yes. We encourage every client to connect with us on Slack. When you need something from a designer, developer, analyst or strategist, you can reach them directly in the channel.
Yes. Custom Shopify app development, headless builds, custom themes, international expansion, integrations and more.
That said, the point of this engagement is to improve your revenue per visitor. When a request comes in that's outside CRO scope, we tend to package it as a separately scoped piece of work so it doesn't interrupt the testing program.
Minimal.
| What | Time |
|---|---|
| Shopify and analytics access at kickoff | 10 minutes, one off |
| Weekly Slack updates from us | 5 minutes to read |
| Review of experiments before launch | 15 to 20 minutes per week |
| Feedback on test designs (async) | 10 to 15 minutes per week |
| Bi-monthly sync call | 1 hour every 2 months |
We handle the research, design, development, QA, launch, monitoring, analysis, reporting and implementation of winners.
Three months is roughly one full testing cycle. You'd expect the diagnosis to have surfaced 10 to 20 high-impact opportunities, with 5 to 15 tested and 3 to 5 producing a measurable win.
In revenue terms, 3 months of testing on a store converting at 1.1% often lifts CVR into the 1.3 to 1.5 range, depending on traffic volume and the severity of the issues we find. The exponential compound doesn't really kick in until months 6 to 9, when the wins start stacking.
Yes. Happy to put you on a call with Nate (Codeword), Charlie (Q30), Casey (Marsh Wear) or James (HashStash). Let us know which vertical matches your questions best and we'll arrange the intro.